Get in touch with ECOFILTRONE™ Company




Turbidity is the cloudiness or haziness of water, caused by particles that scatter light instead of letting it pass straight through. It’s reported in nephelometric turbidity units (NTU). The World Health Organization puts visible cloudiness at 4 NTU and above, and US plants using conventional filtration must never exceed 1 NTU.
The turbidity of water only makes sense in comparison to where it was sampled and the work the water needs to perform. Finished drinking water, recycled water, and reverse osmosis (RO) feed all answer to a different number, and water can read low but still plug a membrane test pad. This guide provides those numbers and then shows what drops them.
Quick Specs: Turbidity
| What it measures | Light scattered by particles at about 90° |
| Common units | NTU (white light), FNU (near infrared, 780–900 nm) |
| Visible to the eye | 4 NTU and above |
| US federal drinking water figures | From 0.3 to 5 NTU, set by treatment process and sampling point |
| RO feed guideline | Below 1 NTU, plus an SDI limit set by the membrane element |
What Is Turbidity?
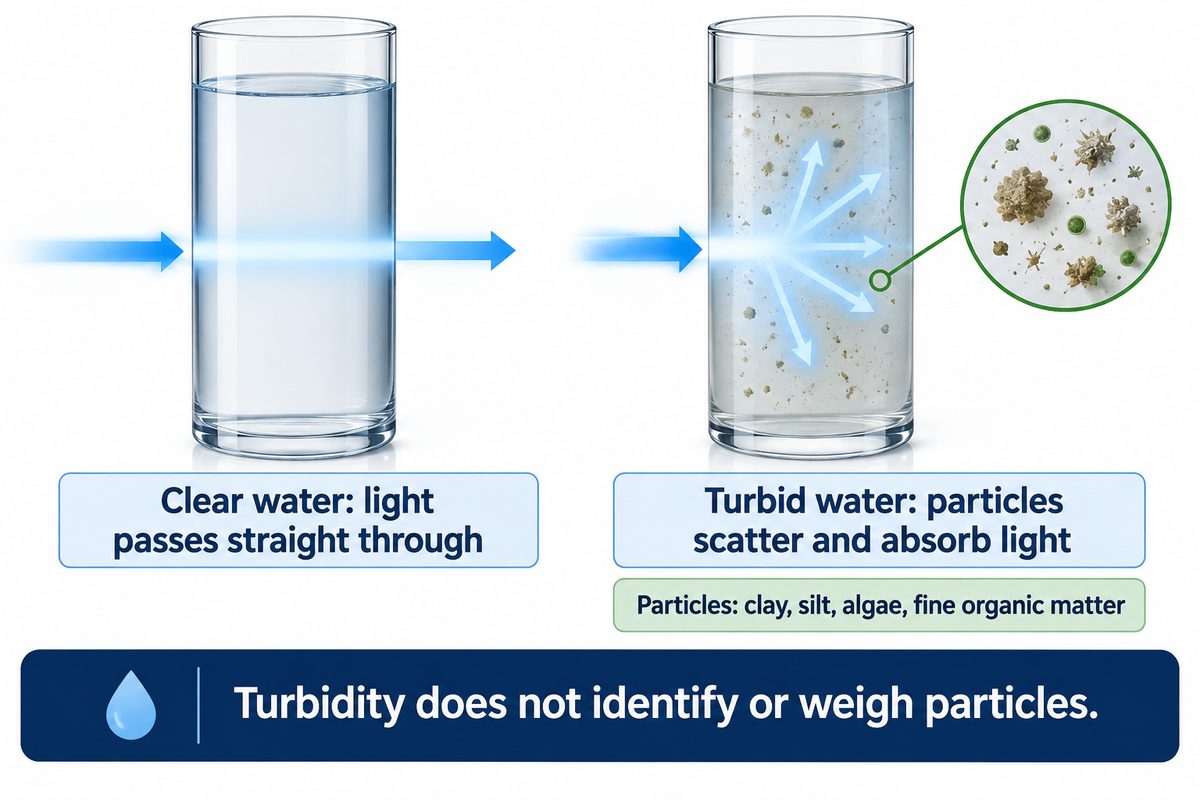
Turbidity is an optical characteristic of a liquid: particles in the water scatter and absorb light rather than transmit it in straight lines. These suspended particles are mostly clay, silt, algae, and fine organic matter. The greater the turbidity, the cloudier or muddier the appearance, and low turbidity means clearer water.
Turbidity isn’t an inherent property of water in the way temperature or pH are, notes the U.S. Geological Survey. It also shifts with the size and type of particles, the color of the water, and the instrument used to measure it.
Understanding turbidity begins here: it’s a water quality parameter that reports how particles behave in light and doesn’t identify them or weigh them. Particles suspended in water could be river silt, algae, or rust, and all will require different solutions.
What an NTU Reading Tells You
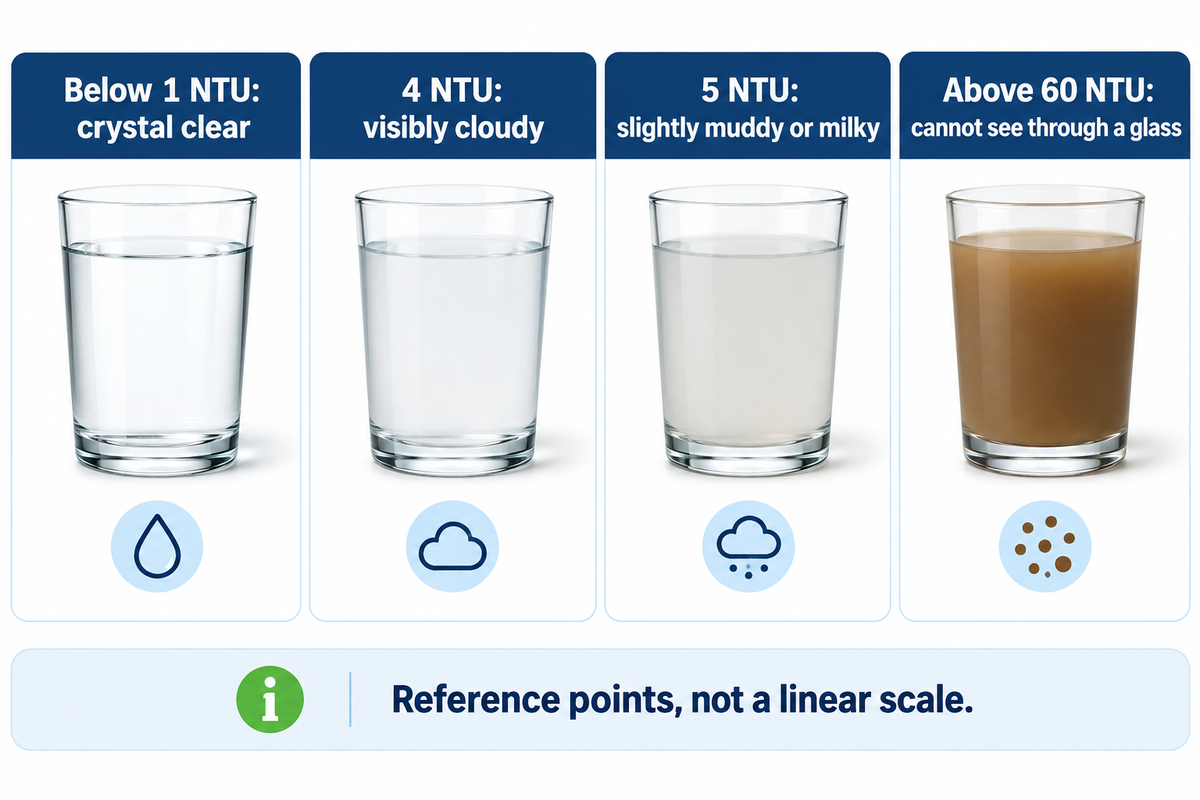
An NTU measurement shows how much light a sample scatters compared to a formazin polymer standard. The higher the turbidity, the more light is scattered toward the detector. Below 1 NTU water looks crystal clear, at 4 NTU it’s visibly cloudy, and above 60 NTU you can’t see through a glass of it.
The indicators are from WHO and the Australian Drinking Water Guidelines, which also give 5 NTU as slightly muddy or milky. These turbidity values describe overall water clarity. Lower NTU values also mean clearer water, but they aren’t a count of particles.
Two samples can have the same reading but not contain the same solids.
What Is NTU in Water?
NTU stands for nephelometric turbidity unit, the turbidity unit used when a meter reads light scattered at right angles to a white-light beam. EPA Method 180.1 specifies a tungsten lamp and a detector centered at 90°, within ±30°. The method covers 0 to 40 NTU, and stronger samples are diluted first.
FNU, the formazin nephelometric unit, uses near-infrared light at 780–900 nm. USGS field instruments use this design and report in FNU. Keep the unit with the number, because the two light sources respond differently to the same water.
What Causes Turbidity in Water?
Suspended sediment and algae often cause turbidity in surface water, while stormwater runoff, soil erosion and disturbed bed material push it up after rain. At a plant, causes switch: oxidized iron, media carryover and floc become the particles suspended in the water. The cause decides the fix, so name it first.
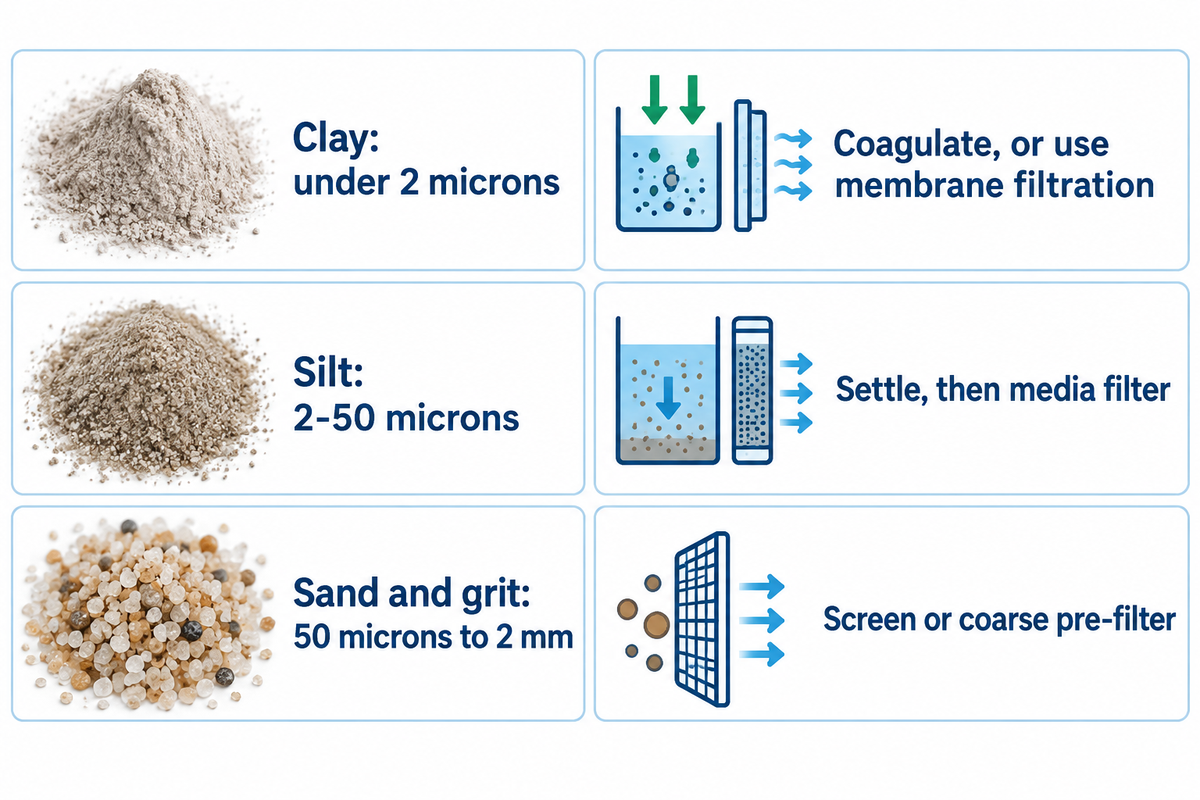
This matrix maps each cause to a next step. Interference rows are from EPA Method 180.1 and the particle sizes are from University of Georgia Extension.
| Cause type | How it shows up | Next step |
|---|---|---|
| Clay | Particles under 2 microns stay in suspension | Coagulate, or use membrane filtration |
| Silt | Particles of 2–50 microns, settle slowly | Settle, then media filter |
| Sand and grit | 50 microns to 2 mm, drop out quickly | Screen or coarse pre-filter |
| Algae | Seasonal rise in lakes and water bodies | Address the raw water source and clarification |
| Natural organic matter | Storm events, coagulant stops working at normal dose | Track organic carbon and adjust the dose |
| Oxidized iron or manganese | Dissolved metal becomes particles after aeration or chlorine | Oxidize first, then filter |
| Filter media carryover | Fine grains downstream of a media vessel | Inspect the filter and its backwash |
| Biological growth | Rising pressure drop with no change in the source | Review residence time and sanitization |
| Fine air bubbles | Falsely high reading that fades as the sample rests | Remove bubbles, then read again promptly |
| True color | Dissolved substances absorb light and lower the reading | Treat color as a separate measurement |
| Coarse settling debris | Falsely low reading as solids sink | Mix the sample and read at once |
Turbidity Limits for Drinking Water and RO Feed
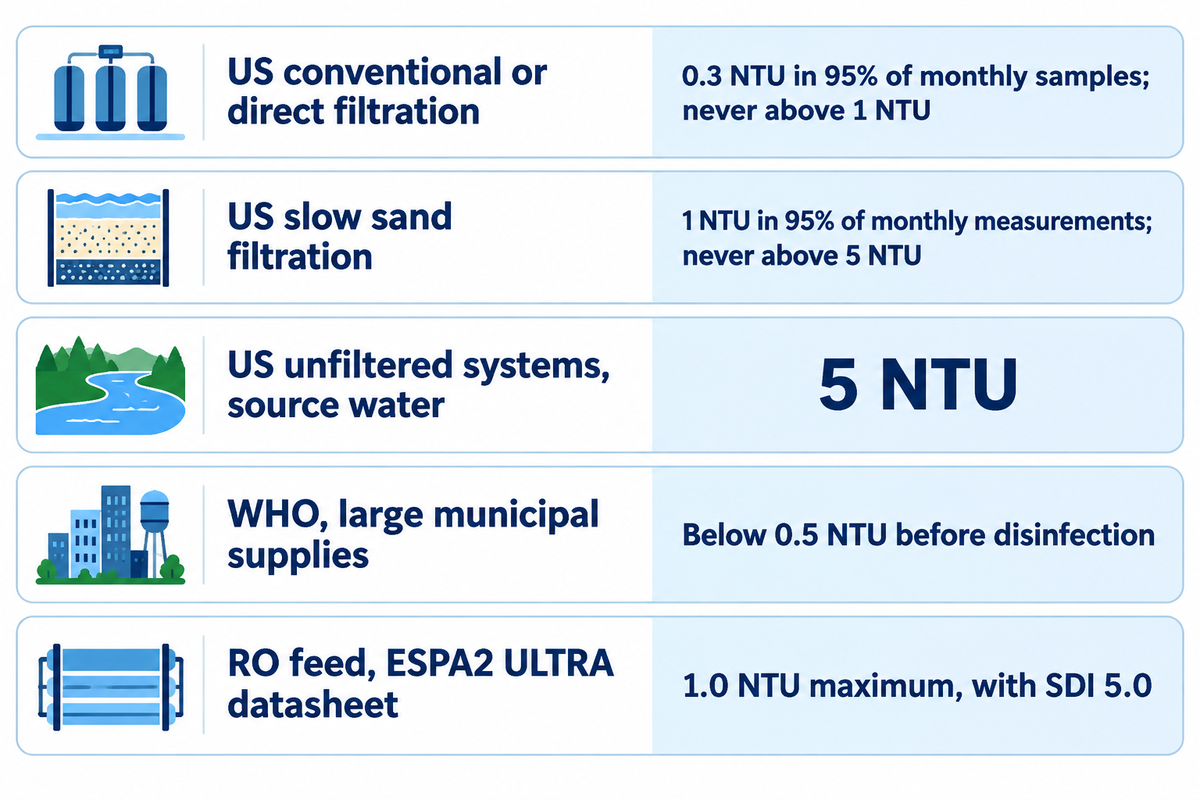
US conventional and direct filtration plants operate to the tightest federal numbers shown below, slow sand plants and unfiltered systems to 1 and 5 NTU. RO feed is normally kept below 1 NTU, with another limit applied to silt density index (SDI). Acceptable turbidity varies by sampling point.
“For systems that use conventional or direct filtration, at no time can turbidity (cloudiness of water) go higher than 1 Nephelometric Turbidity Unit (NTU), and samples for turbidity must be less than or equal to 0.3 NTUs in at least 95 percent of the samples in any month.”
| Water and source | Reference value | Where it is measured |
|---|---|---|
| US conventional or direct filtration | At or below 0.3 NTU in at least 95% of monthly samples; never above 1 NTU | Filtered water at the treatment plant |
| US slow sand filtration | At or below 1 NTU in at least 95% of monthly measurements; never above 5 NTU | Filtered water |
| US diatomaceous earth filtration | At or below 1 NTU in at least 95% of monthly measurements; never above 5 NTU | Filtered water |
| US other filtration types | State limit that cannot exceed 5 NTU | Filtered water |
| US unfiltered systems | 5 NTU, with limited exceptions | Source water before the first disinfectant point |
| EU Directive 2020/2184, operational monitoring of filtration | Reference values: 0.3 NTU in 95% of samples; none above 1 NTU | The water supply plant |
| WHO, large municipal supplies | Below 0.5 NTU at all times; average of 0.2 NTU or less | Before disinfection |
| WHO, small supplies | Aim for below 5 NTU | Before disinfection, lower-resource settings |
| Australia, chlorine disinfection | Below 1 NTU is desirable | At the time of disinfection |
| California recycled water, media filter | Average of 2 NTU in 24 hours; above 5 NTU for no more than 5% of that period; never above 10 NTU | Filtered wastewater |
| California recycled water, membrane | Above 0.2 NTU for no more than 5% of any 24 hours; never above 0.5 NTU | Membrane filtrate |
| RO feed, membrane maker guidance | 1.0 NTU maximum, with SDI 5.0 | Feed water to the RO system |
| US Bureau of Reclamation funded seawater pilot | Below 0.3 NTU and SDI below 5 | Pretreated filtrate to the RO system |
Turbidity measured at a treatment plant addresses a different question from a membrane inlet reading. The level of turbidity a drinking water rule allows says nothing about membrane element operating limits, and a recycled water limit applies only under that permit. For RO, the element datasheet governs.
Hydranautics, as one example, lists 1.0 NTU on its ESPA2 ULTRA element with a feedwater SDI of 5.0 and SDI 4.0 for its ESPA-50. Our RO pretreatment cartridge filtration page explains the cartridge step and the turbidity and SDI records it needs.
What Is the Highest Turbidity Allowed in Drinking Water?
The highest turbidity in drinking water rules in the US is 5 NTU. That’s the ceiling for slow sand, diatomaceous earth and other approved filtration, and the source-water limit at unfiltered systems, with limited exceptions. Conventional and direct filtration’s threshold is 1 NTU.
WHO expects large well-managed supplies to stay below 0.5 NTU before disinfection, and it gives 5 NTU only as the aim for small, lower-resource supplies.
Why High Turbidity Causes Problems
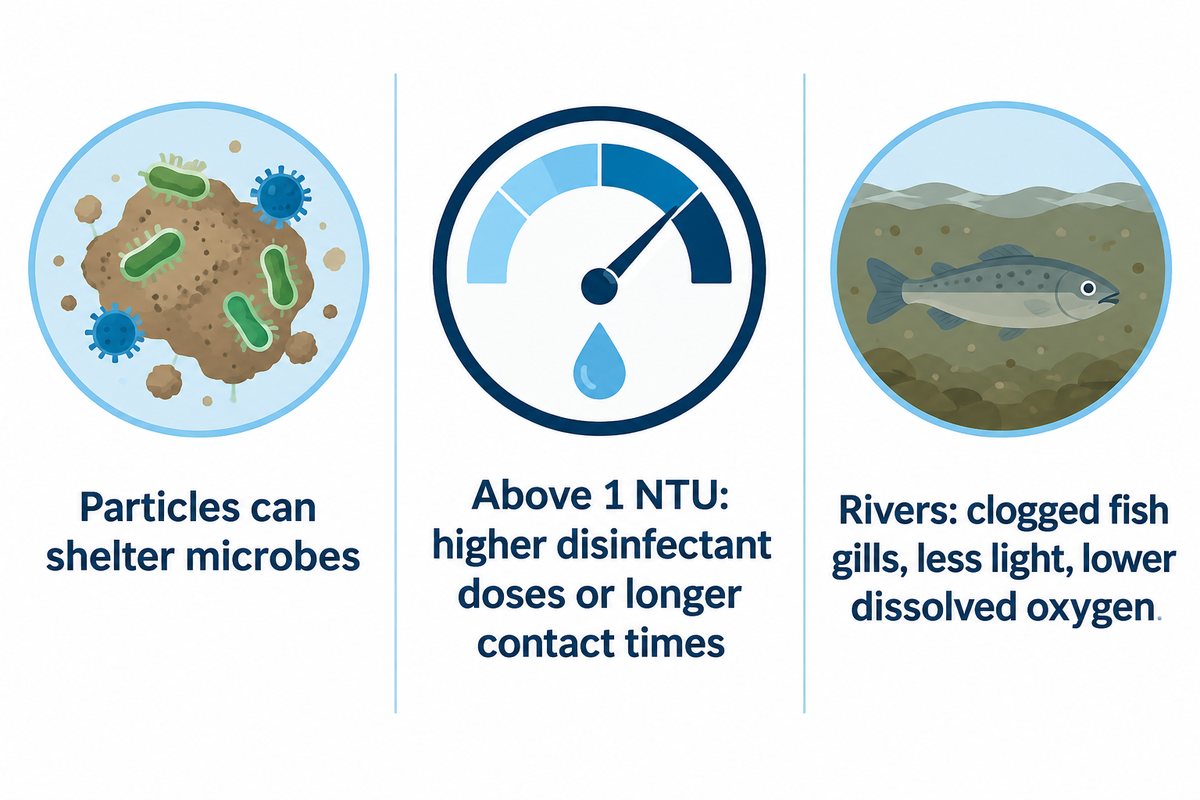
High turbidity levels matter because particles can be a haven for microbes, reduce disinfection effectiveness and foul equipment down the line. WHO states that above 1 NTU, higher disinfectant doses or longer contact times will be required. The impacts of turbidity in rivers and lakes fall on aquatic life and on the plants that fish rely on.
Turbidity is closely tied to treatment performance. EPA considers it an indicator of water quality and filtration effectiveness, and links higher levels with viruses, parasites and some bacteria. That association has a limit.
WHO states a direct proportional relationship between removal of turbidity and pathogens has not been demonstrated. A dropping number is encouraging about particles, so tests for microbes continue too.
For natural water, EPA’s turbidity fact sheet lists clogged fish gills, less light for aquatic plants and lower dissolved oxygen. To protect water quality, EPA’s narrative criterion says that solids shouldn’t cause the depth of the photosynthesis compensation point to decrease more than 10% from the seasonal norm. Higher turbidity levels in water can mean more treatment for any water system that relies on that river, including irrigation water.
How Turbidity Is Measured
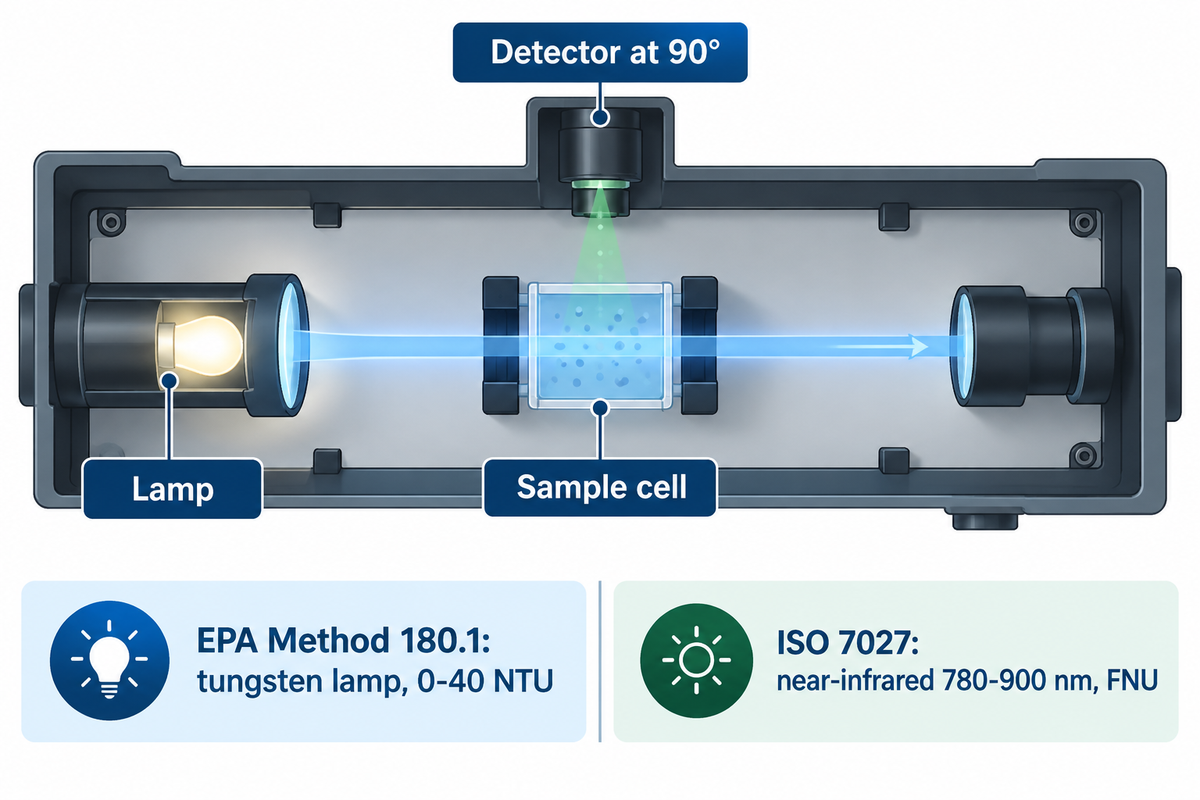
Turbidity is measured with a nephelometer, which shines light through a water sample and reads the amount of light scattered at approximately 90°. Secchi disks and tubes provide a field visual estimate. When the result supports a permit, trial or filter choice, use a calibrated meter.
| Method | How it works | Best use |
|---|---|---|
| EPA Method 180.1 meter | Tungsten lamp, 90° detector, 0–40 NTU | US regulatory turbidity measurement |
| ISO 7027 nephelometric sensor | Near-infrared light at 780–900 nm, reported in FNU | Environmental monitoring and online readings |
| Secchi disk | Depth at which a disk disappears from view | Water clarity in lakes and deeper rivers |
| Turbidity tube | Water depth at which a target disappears | Quick field screening of streams |
Which Instrument Measures Turbidity?
The measurement tool is called a turbidimeter (also referred to as a nephelometer). It contains a light source and one or more detectors and compares the sample to a calibration standard. Portable and benchtop models read grab samples; inline sensors monitor turbidity continuously.
Match the instrument to the rule since EPA and ISO designs use different light.
Three habits help keep turbidity readings honest in routine water monitoring. Mix the sample gently and fill the cell without adding bubbles, because EPA Method 180.1 warns that fine bubbles read high. Measure quickly, as fast-settling debris reads low, and keep the optics clean, because USGS notes that biological growth on a sensor can bias a result low while scratches can bias it high.
Compare results only across matching devices. A US Army Corps of Engineers technical note found no universal relationship between measurements of the same suspension using different devices.
Turbidity vs TSS, TDS and SDI
Turbidity reports scattered light in NTU, total suspended solids (TSS) dry mass in mg/L, and total dissolved solids (TDS) dissolved mass in mg/L. SDI measures the rate at which water plugs a 0.45 micron pad. Use TSS for discharge permits and solids loading, and turbidity plus SDI for RO feed water decisions.
| Measure | What it reports | Unit | Ask for it when |
|---|---|---|---|
| Turbidity | Light scattered by particles | NTU, FNU | Tracking filter performance in real time |
| TSS | Dry mass caught on a filter | mg/L | Sizing filters and reporting discharge |
| TDS | Dissolved mass that passes a filter | mg/L | Sizing RO and checking salinity |
| SDI | Plugging rate of a 0.45 micron pad at 30 psig | Index, no unit | Judging RO feed fouling potential |
Can You Convert NTU to mg/L?
There’s no general conversion factor from NTU to mg/L. The US Army Corps of Engineers points out that no universal relationship exists between turbidity and suspended solids, as they are measures of different parameters. A local conversion curve can be established with pairs of samples but it’s valid only for that suspension and must be reconstructed whenever the particles change.
To establish one, take samples throughout your normal range, measure both parameters in each sample, and fit a calibration curve. Recheck after a storm or process modification. The Corps calls for curves that are suspension-specific, not just site-specific; a curve based on dry-weather flow will mislead you in a storm.
Turbidity-SDI Pairing Check
SDI requires a little multiplication and division. The formula in the Hydranautics SDI procedure is SDI = 100 × (1 − Ti/Tf) / Tt. Ti is the time to collect 500 mL at the start, Tf is the same collection at the end, and Tt is the total test time in minutes.
📐 Example: Ti = 30 seconds, Tf = 60 seconds, Tt = 15 minutes. Plugging is 100 × (1 − 30/60) = 50%, and SDI = 50 / 15 = 3.3. That clears a 5.0 element limit but sits above the 3.0 line discussed below. Plugging should stay at or under 75% for an accurate result, so shorten the test if the pad blocks sooner.
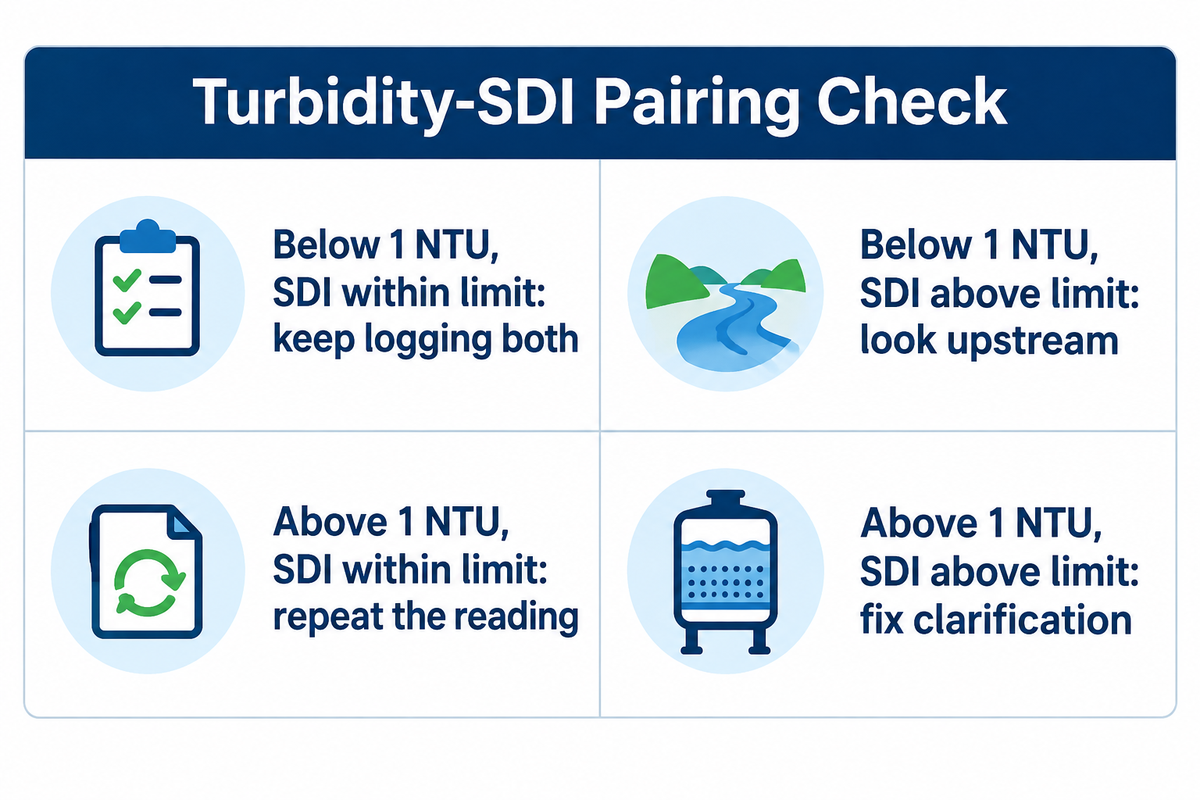
Turbidity and SDI can move together at a particular site. At Tampa Bay Desal I, pretreated seawater above 0.20 NTU typically indicated an SDI above 3.0, according to a US Bureau of Reclamation report. That’s one plant’s pattern, so log both numbers and come up with your own. The Turbidity-SDI Pairing Check below reads both together, with 1 NTU and your element’s SDI threshold as the dividing lines. Once feed is in range, cartridge choice becomes the next decision.
| Turbidity | SDI | Likely meaning | Do this |
|---|---|---|---|
| Below 1 NTU | Within limit | Feed is in range | Keep logging both at the same flow |
| Below 1 NTU | Above limit | Fine colloids or organics a meter barely sees | Look upstream at coagulation or ultrafiltration before buying a finer cartridge |
| Above 1 NTU | Within limit | Particles that scatter light without plugging the pad, or bubbles and dirty optics | Mix gently, remove bubbles and repeat the reading promptly |
| Above 1 NTU | Above limit | Solids are passing the main barrier | Fix clarification or media filtration; a cartridge will plug fast |
How to Reduce Turbidity in Water

Reduce turbidity by removing solids in several steps: coagulate fine particles, let flocculation grow them, settle the heavy load, filter through media or membranes, then polish. WHO says large well-run supplies should be able to stay below 0.5 NTU before disinfection. Asking a final filter to support the entire load makes it plug quickly.
Each stage in the drinking water treatment process has a job. Coagulants and polymers neutralize the charge on fine clay so particles can clump together. Sedimentation removes most of the mass. Media filters and filter cartridges catch what’s left. In one Bureau of Reclamation seawater study, the design goal for membrane filtrate water sent to RO was a water turbidity below 0.3 NTU and SDI below 3.0.
A process that works in dry weather can still fail in a storm. An Alabama plant saw its effluent pass 15 NTU after a winter storm and shut down for three days, even after raising coagulant to 86 mg/L from about 30 mg/L. Researchers traced the failure to natural organic matter at 6.14 mg/L as total organic carbon, so they advised dosing against organic carbon as well as turbidity. Good water management for an industrial water system means watching the same signal when the source changes.
What Cartridge Filters Can and Cannot Do for Turbidity

Cartridge filters polish water that’s already fairly clear, and a 5 micron element is a common starting point before RO. Capture efficiency depends on particle size, so the nominal rating doesn’t guarantee full retention. Mechanical filtration with a cartridge doesn’t remove dissolved chemicals, and high, consistent solids will make the cartridge the primary barrier and it will become blocked rapidly.
What Micron Filter Lowers Turbidity?
Begin with a 5 micron filter cartridge, a common design reference for your last filter before RO, and if the filtrate turbidity remains high, check upstream first, then trial a 1 micron and compare pressure drop. No micron rating guarantees an exact NTU, because results follow the particle sizes in your water. A 20 micron filter may miss clay below 2 microns, reports University of Georgia Extension.
A 2021 study from Ulster University shows how much filter type and staging can matter. Researchers fed household-scale filters with test dust at 40 ± 10 NTU until they reached a 1 bar pressure limit. A 1 micron wound filter treated 0.85 m³, while 5 and 1 micron pleated filters in series treated 6 m³. Pleated filters reached below 5 NTU as a cake built up, and field units with 5 and 1 micron spun filters in Colombia reached below 1.2 NTU on natural water. These are household trials and the two results differ in both construction and staging, so run your own comparison.
Staging and surface area will often trump a smaller figure. Read about the differences between nominal and absolute micron ratings, and check out pleated vs melt blown cartridges before ordering. For finer duties, take a look at the guide to 0.2 micron filter cartridges.
The table below shows the ranges of four of the families we publish.
| Family | Micron range | Temperature | Role |
|---|---|---|---|
| PP melt blown | 1–100 µm | Up to 65 °C | Depth loading and economical pre-filtration |
| PP string wound | 1–100 µm | Up to 80 °C | Depth loading with a chosen core |
| PP pleated | 0.1–100 µm | Up to 80 °C | More surface area at a 69 mm outside diameter |
| PP pleated high flow | 0.3–100 µm | Up to 80 °C | Fewer large elements at high flow, 154 mm OD |
Choosing a Cartridge Supplier for Turbid Feedwater

Select a vendor who inquires about your feedwater data prior to providing a quote. Qingdao-based ECOFILTRONE manufactures pleated, melt-blown and string-wound cartridges, and stocked items can be prepared in 4–5 days, custom samples in 7 days and custom batches in 14 days after the specification is confirmed. Minimum custom order quantity is 100 pieces.
For high-flow housings, ECOFILTRONE develops replacements for selected Pall, 3M/CUNO, Parker and Pentair families and checks each match against the model, drawing, seal and flow direction.
Send turbidity and SDI test results, source water, upstream treatment, design flow, housing model, flow direction and temperature. Price depends on media, dimensions, end configuration, seal, retention performance and quantity, so a per-piece price tells you little without those details. Check cost per treated volume at the same flow and feedwater.
See the RO pretreatment guide for the complete selection steps and high-flow filter cartridges for large housings.
What Is Changing in Turbidity Monitoring
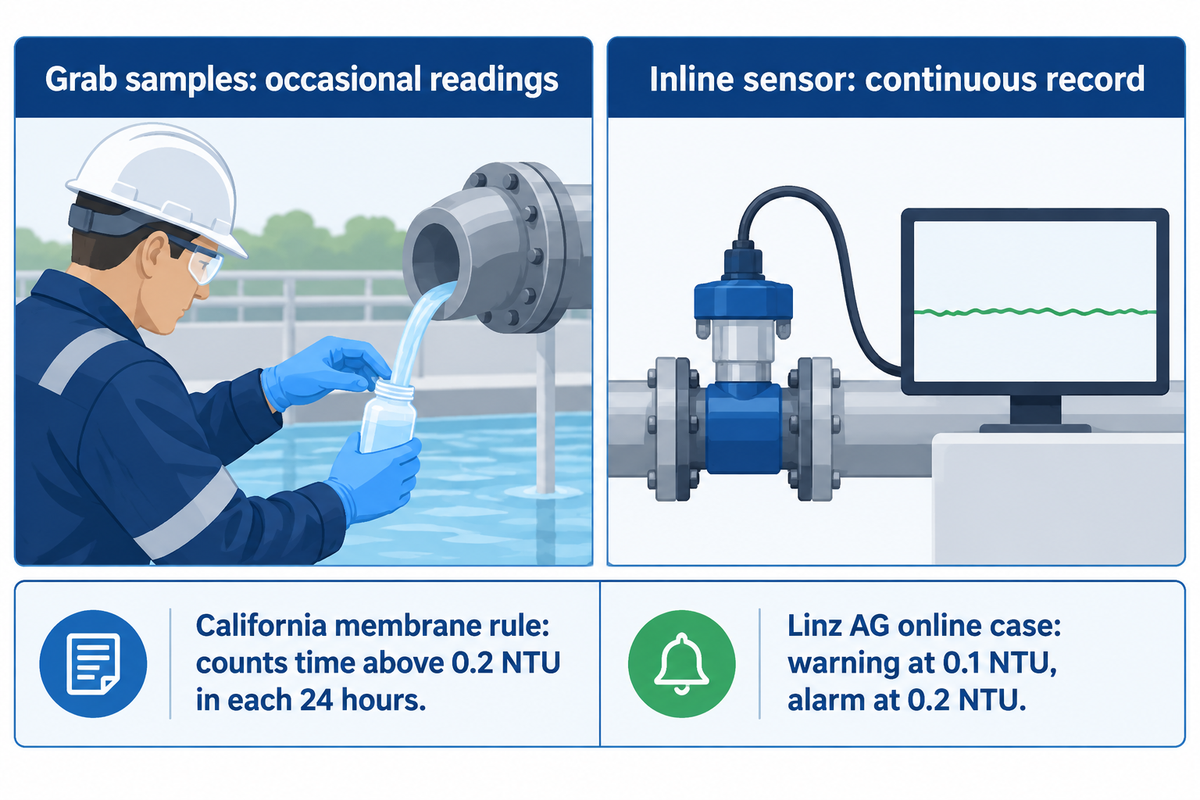
Several rules and guidance documents emphasize continuous turbidity monitoring. WHO notes that in higher-resource settings, filtered water should typically be tracked continuously online, and the EU directive (2020/2184) has established its reference value at the water supply plant. That means the real-world change is proof over time, more than a new NTU number.
A sponsored case in Wastewater Digest shows what that looks like at Linz AG in Austria: a warning at 0.1 NTU and an alarm at 0.2 NTU, with records kept for the water authority. Water reuse rules work the same way: California’s membrane-filtered wastewater rule counts time above 0.2 NTU within each 24-hour period. If your plant handles wastewater filtration and water reuse or protects scarce water resources, price an inline sensor against the labor of grab samples. Set a warning below your limit so operators can act before the limit is reached.
Frequently Asked Questions
Q: Is turbidity good or bad?
Turbidity is neither good nor bad on its own, but the lower the better in drinking water and RO feed.
Particles foul membranes and impede disinfection, so the plant drives the reading down. In a natural river, turbidity can rise after rain, but persistently high levels can harm aquatic life.
Q: Can turbidity be zero?
A meter may show zero when turbidity drops below its resolution, but that doesn’t mean the sample has no particles in it.
The Australian guidelines cite about 0.1 NTU as the detection limit for the standard formazin-calibrated method. For very low readings, stray light, the sample cell and air bubbles can shift the result as much as the water does. Take small variations as indicative only.
Q: Does high turbidity mean the water is unsafe?
Not alone, as a high reading indicates the presence of particles but doesn’t specify what they are.
Those particles can also hide microbes from disinfectant, so regulators view an increase as a warning about filtration. Microbial and chemical tests reveal what’s in the samples drawn, so they should sit alongside treatment records. A sudden increase above a plant’s baseline is a red flag for an investigation.
Q: Is turbidity the same as clarity?
They describe the same effect from opposite ends: higher turbidity means lower clarity of water, and turbidity is the instrument reading.
Q: Does turbidity affect disinfection?
Yes. Particles can protect microbes from chlorine, so treatment plants reduce turbidity before disinfection. WHO says higher doses or longer contact times are required above 1 NTU.
Q: What is turbidity for kids?
Turbidity is how cloudy water is. Tiny bits of mud and algae bounce light around and make the water look all hazy.
Bring your numbers: Send your turbidity and SDI log with your housing model, and we can review whether a cartridge change will help or whether the fix sits upstream.
Request an RO Cartridge Selection Review →
About This Analysis
The turbidity limits here were read from source text from EPA, WHO, EU and California, and cartridge ranges are obtained from our product tables. Published by Qingdao ecofiltrone Industrial Technology Co., Ltd. Figures were traced back to the sources listed below.
References & Sources
- National Primary Drinking Water Regulations US EPA
- 40 CFR 141.71, criteria for avoiding filtration Legal Information Institute
- 40 CFR 141.73, filtration Legal Information Institute
- Water Quality and Health: Review of Turbidity, 2017 World Health Organization
- Directive (EU) 2020/2184 European Union
- Turbidity U.S. Geological Survey
- Use of Multiparameter Instruments for Routine Field Measurements U.S. Geological Survey
- Method 180.1, Determination of Turbidity by Nephelometry US EPA
- Turbidity Parameter Factsheet US EPA
- Australian Drinking Water Guidelines: Turbidity NHMRC
- Improved Methods for Correlating Turbidity and Suspended Solids for Monitoring US Army Corps of Engineers
- Evaluation of Desalination on Waters Under the Influence of Surface Water Runoff, Report 113 US Bureau of Reclamation
- Pretreatment and Design Considerations for Large-Scale Seawater Facilities, Report 137 US Bureau of Reclamation
- Cal. Code Regs. Tit. 22, § 60301.320, Filtered Wastewater Legal Information Institute
- Assessment of low-cost cartridge filters for implementation in household drinking water treatment systems Ulster University
- Mechanical Filtration Methods and Devices University of Georgia Extension
- Winter storm coagulation case study, 2019 International Journal of Environmental Research and Public Health
- Online Measurement of Turbidity in a Drinking Water Distribution Station Wastewater Digest (sponsored)