
Get in touch with ECOFILTRONE™ Company




Bank operating scope
- Map the feed header, online vessels and downstream pressure requirement.
- Separate peak, standby, isolation and restart states.
- Measure useful production across the bank’s actual service cycle.
- Compare whole-bank changeout costs using quality-released volume.
Updated October 2026
One vessel is isolated for changeout. The other branches carry the production demand. However, the control-room trend continues to show total flow and one pressure difference. When the vessel returns, another operating transition begins. Glass Fiber High Flow Filter Cartridges require a bank operating record that shows those states, not just a ‘clean-element’ rating.
Glass Fiber High Flow Filter Cartridges capture particles in large-format elements. Operate the bank of cartridges against a defined flow, quality and pressure envelope. Record which branches are on-line, compare peak demand and record isolation and restart as separate states.
The glass-fiber pleated cartridge fundamentals guide includes information on media selection and micron ratings as well as general pressure diagnosis. This discussion follows the connected high-flow bank: where duty is lost, what changes during an intervention and how to hand over a repeatable operating record.
Start with the bank state
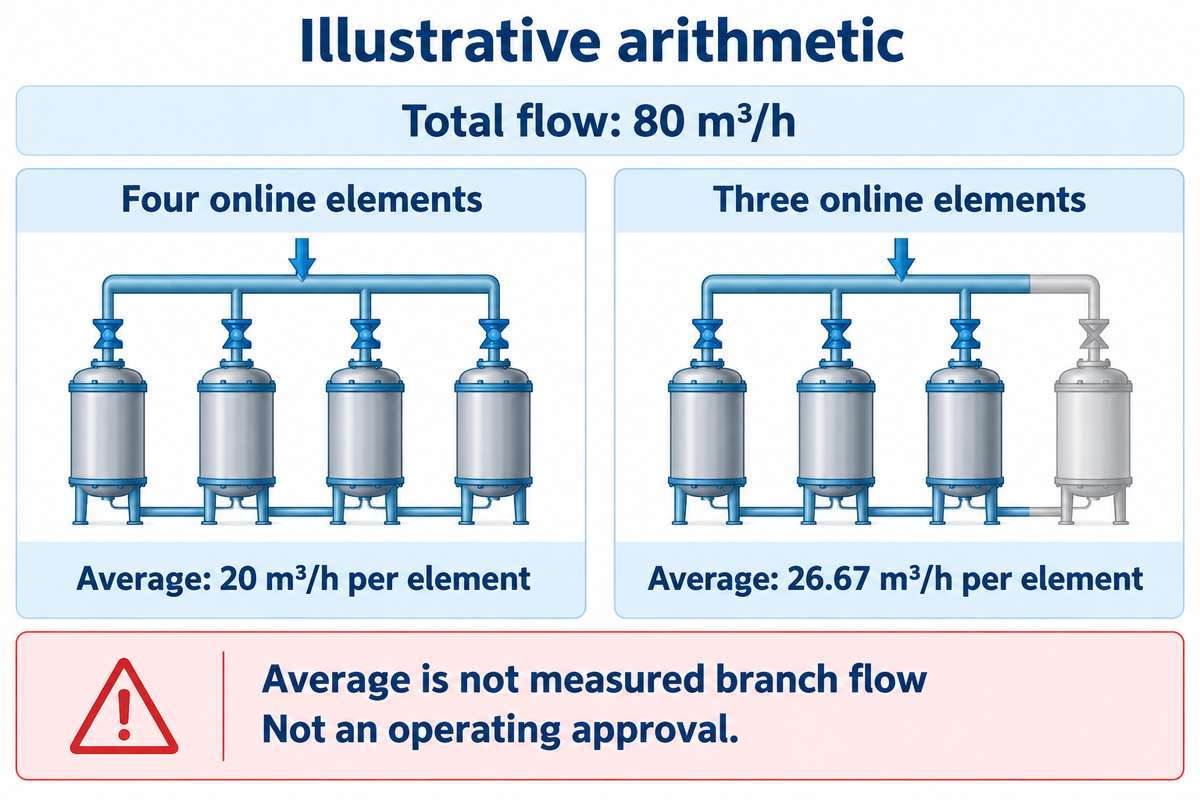
- Total flow divided by element count is an average, not a measured branch flow.
- One isolated vessel changes the available path even when production demand stays constant.
- A clean restart and a loaded restart need their own time-stamped records.
- Changeout economics must include the useful volume delivered through those transitions.
Define the Duty of the Installed High Flow Cartridge Bank
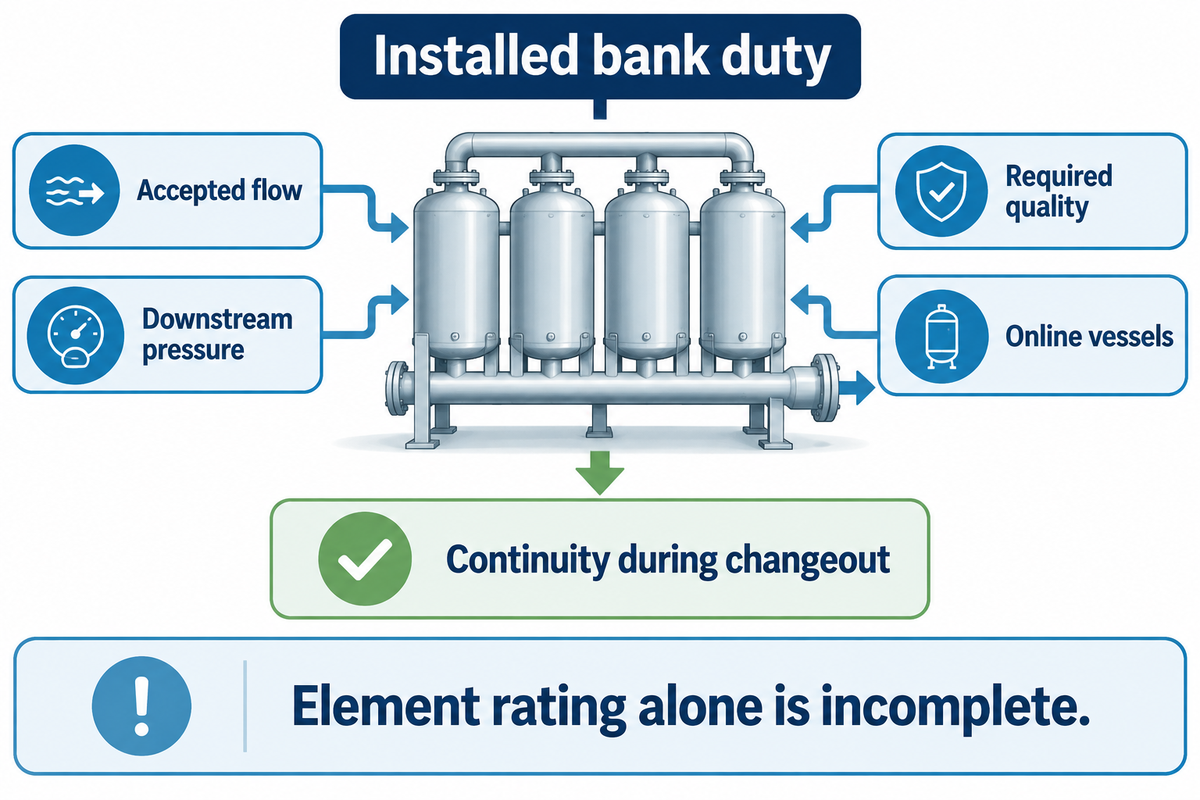
Define bank duty as the required accepted flow at the downstream pressure and quality, with the planned vessels in service. Element flow capacity alone leaves out the common headers, vessel connections and the continuity requirement during an intervention.
How do high flow filter cartridges work?
High flow filter cartridges pass liquid via large-format, porous elements that capture particles. A pleat adds media within the available envelope, while the complete assembly controls the liquid path. In an installed bank, the feed divides among online elements, and recombines downstream. The operator’s task is to preserve that separation and deliver the required quality through changing bank states.
Glass fiber media identifies the particle-capture material; high flow describes the format and function. A large-diameter pleated filter can contain polypropylene supports, resin or other binders, and end-caps and seals. Maintain the approved construction and retention basis with the model identifier. General material comparison belongs in the fundamentals guide rather than being repeated at each bank change.
Pleated filter cartridges remain replaceable elements within the installed unit. Fix filtration efficiency and the approved micron rating during a bank comparison. A high dirt-holding capacity claim belongs beside its test conditions, not in place of the bank’s actual loading record. The required liquid filtration result is an input to this operating guide, not a basis for a new media-selection evaluation.
The 2012 EPA/NSF bag-and-cartridge verification protocol treats the filter unit as media, housing and associated piping and valves within its drinking-water test program. Use that complete-unit perspective when listing the industrial equipment boundaries: identify what was installed and which parts were included in a measurement.
Set a continuity requirement before selecting the operating arrangement. Can production pause for a complete changeout, or must an approved standby path remain available? A procurement choice based on fewer cartridges can lose its handling advantage if access, isolation or the restart sequence lengthens the interruption. Product dimensions and fit remain on the HFA configuration and replacement solution page.
Record the installed unit. A 20-inch element and a 40-inch element are different physical interfaces, even with the same media description. Put vessel identity and online element quantity beside the drawing. A bank duty record requires the state of the equipment and the total flow.
Trace the Installed Flow Path and Gauge Boundaries
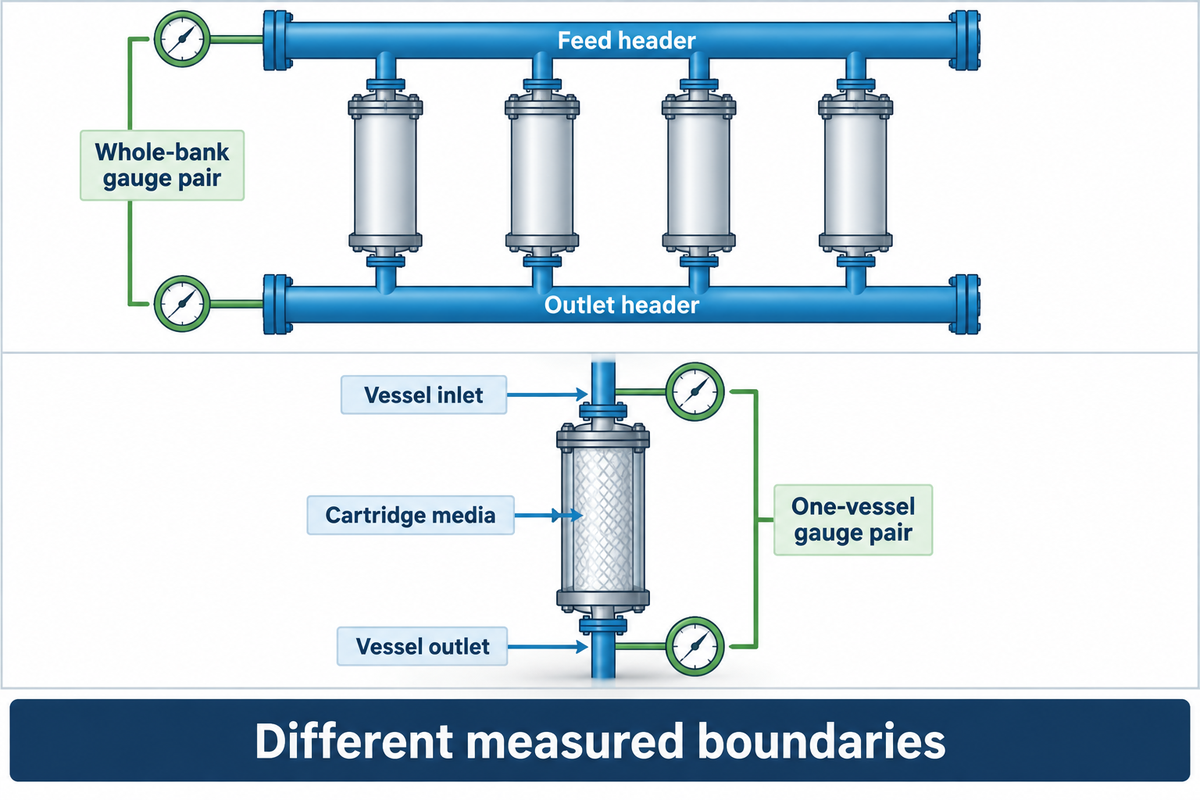
Trace the common feed header, the dirty side of each vessel and the media path, the connection to the clean side, and the outlet header. Also, identify pressure taps along that path. A reading across the complete bank includes different components from a reading across one vessel; neither automatically reveals the loss in an individual element.
The HF-G element is described as flowing ‘inside out’ by Eaton. The polypropylene HF/HFM family, on the Solventum-hosted product page, uses flow from outside to inside. The HFA drawing along with the Eaton HF-G description requires an independent check; a high-flow pleated label, or similar outside diameter, isn’t adequate.
For every gauge pair, write the actual boundary in plain language: common-header to common-header, vessel inlet to vessel outlet, or another documented pair. Maintain tap locations when comparing runs, including the initial pressure drop. ISO 3968:2017 addresses differential pressure versus flow for hydraulic filters and assembly components, including the influence of viscosity. The official public scope gives the measurement context; the site’s drawing identifies the components actually bounded.
Preserve the boundary
- Record the vessel and both tap locations.
- Keep online branch status beside each reading.
- Pair the pressure sample with simultaneous flow and temperature.
Avoid a false trend
- Do not compare unlike gauge boundaries as one series.
- Do not infer element flow from a common-header gauge.
- Do not omit an isolation or valve-state change.
Allocate the available pressure budget for required downstream service. A restriction in the common header affects all vessels connected through it; adding filtration area inside a cartridge does not remove that restriction. The operating envelope must cover pressure and temperature together, plus the actual liquid and any cleaning exposure.
The filter housings and their port geometry belong on that drawing. Record inside-to-outside where it is the model’s declared path. Retain any polyester support designation in the element’s material declaration, and the exact filter material identification. As an assembly interface, high flow housing is not a capacity result. EPDM or Viton, as the seal declaration specifies, must be kept in the record.
Maintain compositions of solvent as fixed in the application. Record an approved high-temperature exposure separately from normal production. A low pressure drop in a standby condition can’t determine loss at peak flow. These entries let industrial filtration systems retain one traceable boundary through changing operating states.
Locate the Bottleneck in a High Flow Filter Bank
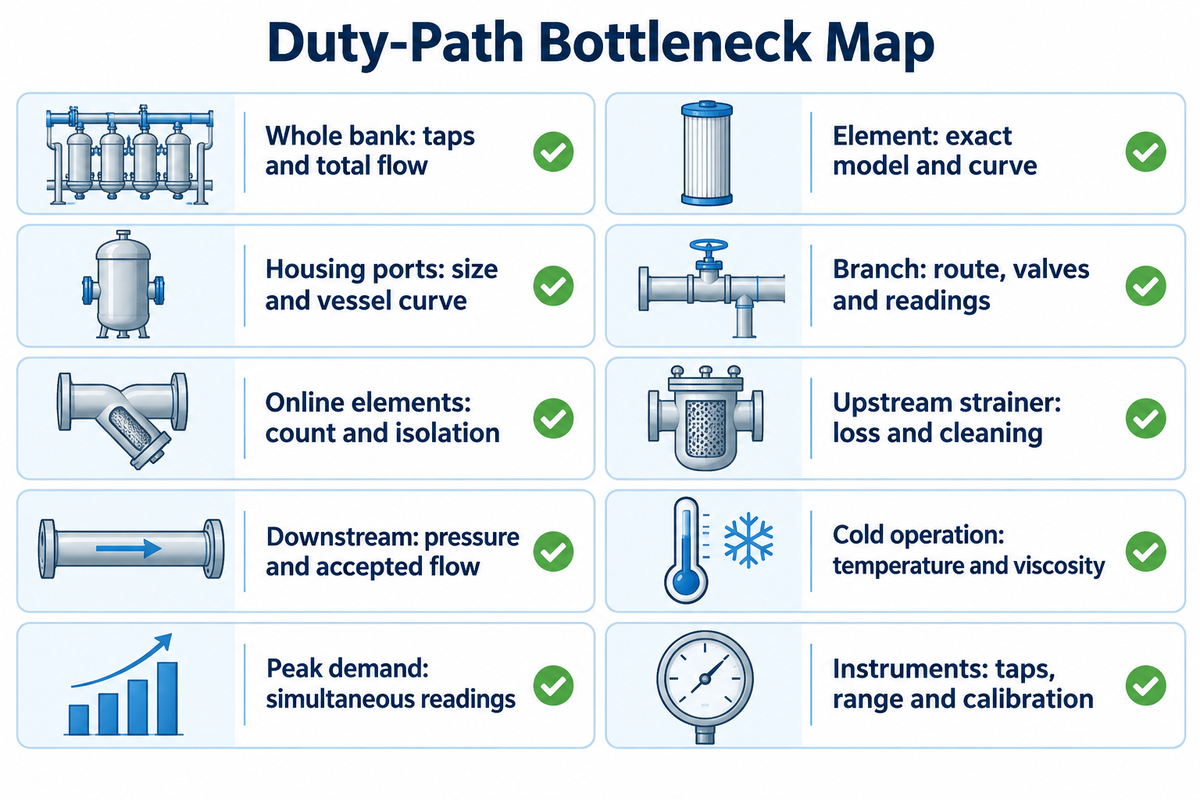
Locate restrictions where they occur, e.g. in equipment: the element, vessel, connecting branches, and downstream components. Exactly show which pressure taps correspond to a reading, and the flow and number of branches on line. A total bank pressure drop accounts for several losses. Dividing total flow by element count is an average, not a measurement of each element’s actual flow.
There are physical reasons to review connections. Krupp and colleagues’ multi-capsule depth-filtration model includes resistance in the filters and the pipes before and after them. The pharmaceutical model provides stated flow and fouling assumptions, and includes Pall participation and funding. Its lesson, here, is to measure the connected system, rather than assume equal branch duty.
Duty-Path Bottleneck Map
| Boundary or condition | Record | Decision it supports |
|---|---|---|
| Whole bank | Inlet/outlet taps and total flow | Establish the installed loss budget. |
| Element assembly | Exact model and applicable curve | Separate media duty from vessel losses. |
| Housing ports | Port size and vessel curve | Identify a connection restriction. |
| Branch connection | Pipe route, valve position, available branch readings | Investigate unequal branch conditions. |
| Online elements | Actual element count and isolation state | Identify a duty change after isolation. |
| Upstream strainer | Separate loss and cleaning events | Avoid blaming the cartridge for upstream blockage. |
| Downstream process | Required inlet pressure and accepted flow | Keep the process requirement in the budget. |
| Cold operation | Temperature and corresponding viscosity | Compare against the appropriate fluid curve. |
| Peak demand | Simultaneous flow and pressure | Check the real peak rather than an isolated maximum. |
| Instrumentation | Tap condition, gauge range and calibration | Check the measurement before changing hardware. |
Example: a bank carries 80 m³/h during production and 40 m³/h during standby. A reading taken during standby can’t establish the pressure needed at production flow. If one branch was also isolated, both the total demand and the available flow path changed. Compare simultaneous states before assigning the increase to solids loading. Individual branch flow still requires its own measurement or a validated hydraulic model.
Justifying a large element purchase is difficult if the loss is in a partially closed valve. On the other hand, a low clean bank loss gives little information about loading reserve. The procurement decision follows the measured boundary and the required continuity of service, including whether production can tolerate an isolated branch.
Report a measured flow of a branch in m³/h, or gpm per element, only if that boundary was measured. Keep nominal length, including a 60-inch designation if applicable, separate from the flow measurement. A high flow capacity label doesn’t measure the flow of the branch.
Test Peak Demand, Standby, Isolation and Restart as Separate States
Test the operating states that change the available flow path or demand of the bank. A steady state measurement can’t show an isolated vessel, or a cold start up or a restart after a loaded run. Use a time stamped state change to separate a change in operating conditions from a change in cartridge.
What changes when one branch is isolated?
The available parallel path decreases while the remaining branches carry the demand the system actually supplies. Their flow distribution and pressure losses can change. Do not assume that the control system will maintain production flow, or that each remaining branch shares it equally. Compare the observed state with the approved duty for that online situation before continuing the trial.
For a simple reporting example, an 80 m³/h total with four online elements gives an average of 20 m³/h per element; with three online, the same total gives 26.67 m³/h. These arithmetic averages represent the changed loading situation. They don’t state the actual flow, the capacity remaining or give authority to run in that condition.
Bank-State Comparison Matrix
| State | Record together | Decision supported |
|---|---|---|
| Clean commissioning | All online paths, flow, temperature and pressure boundary | Establish the reference for that arrangement. |
| Normal production | Accepted flow and simultaneous bank readings | Check delivery against the current duty. |
| Peak demand | Actual demand, online branches and downstream pressure | Identify where production headroom is consumed. |
| Cold startup | Temperature, fluid viscosity basis and achieved flow | Separate fluid-condition effects from loading history. |
| Loaded operation | Cumulative volume, quality sample and current arrangement | Compare loading at a defined bank state. |
| Approved branch isolation | Isolation time, remaining paths and achieved flow | Check continuity with less equipment online. |
| Vessel return to service | Procedure completion, valve state and paired quality sample | Release the returned path under the acceptance plan. |
| Loaded restart | Off-time, restart time, flow transition and quality sample | Inspect the event separately from steady operation. |
| Standby flow | Demand and the online arrangement | Avoid comparing standby pressure with peak duty. |
| Upstream feed upset | Feed event, time, solids tests and affected volume interval | Distinguish a feed change from a new cartridge effect. |
In their published pressure-monitoring article, Valin’s Joe Bodle and Jay Jett ask:
“what differential pressure is the filter being changed at?”
For a bank, indicate which branches were online at the time. A replacement decision and the condition during an isolation are different situations. Use the existing fundamentals guide for general replacement endpoints; keep this matrix focused on the states before, during and after the intervention.
An archived EPA/NSF verification of a Rosedale bag-and-cartridge system reported brief particle sloughing after an interruption. The same historical study also attributed one train’s poor removal to a faulty differential-pressure gauge that allowed feed water to bypass into the filtered stream. These specific external observations support keeping restart quality and instrument condition in the event record.
Sampling also requires a volume boundary. Mark the meter readings for start up, release, upsets and the next accepted sample. Segregate pending/rejected liquid in accordance with the site’s plan. A stable pressure trace doesn’t justify carrying a previous quality result across an unsampled restart.
A high flow rate observed during a peak is a state result, not the complete cycle. In industrial water prefiltration, record upstream cleaning and element changes as events as well. If that upstream stage uses a string wound filter, record its identity and time it was changed in the bank record as well.
Compare equal states. An assumed 0.4 bar at 40 m³/h standby and 0.8 bar at 80 m³/h production represent different operating conditions. Match the online arrangement as well as flow and temperature before interpreting a loading trend. The distinction between these conditions prevents a bank state change from being misdiagnosed as a cartridge condition.
Compare Whole-Bank Changeouts by Accepted Volume
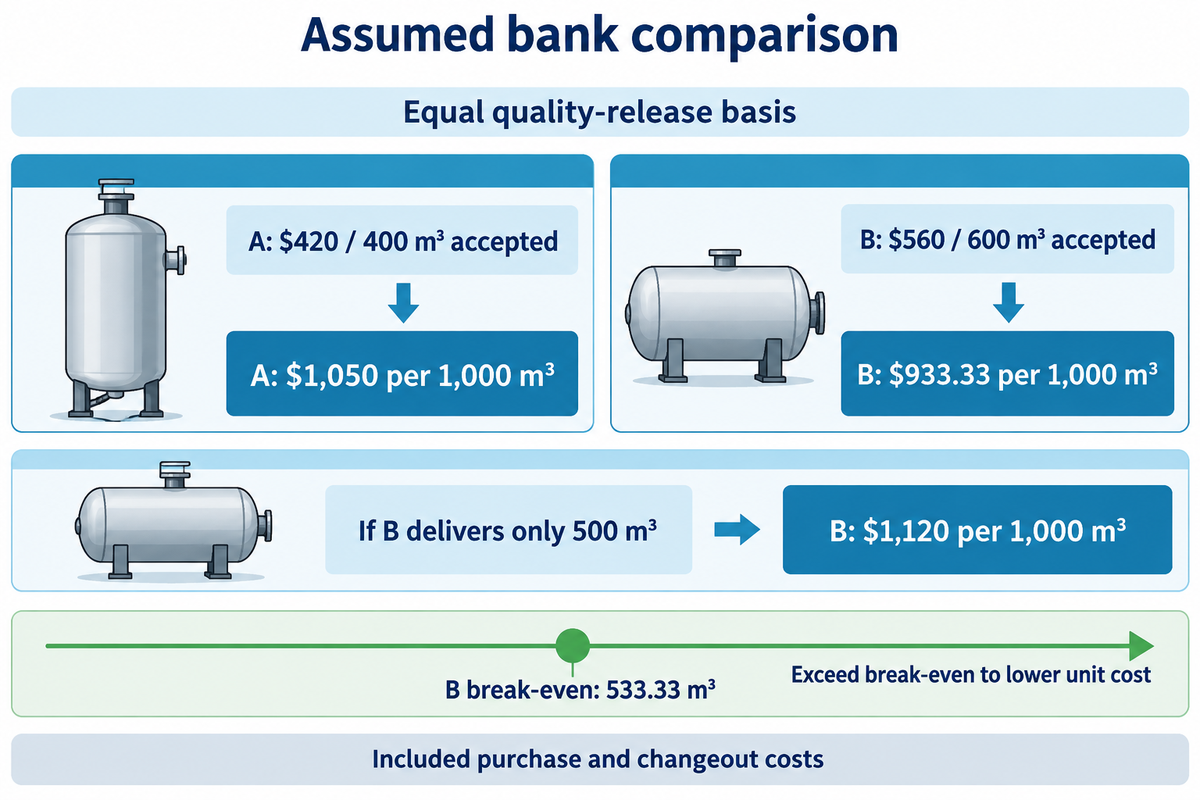
Compare whole-bank intervention costs against the accepted volume delivered through the corresponding service cycle. Consider the element quantity actually replaced, as well as the scheduled interruption. Continuous operation of a bank at a reduced flow can result in less useful production; under certain conditions, the time required for a changeout can become a factor when the process has little continuity reserve.
The DOE, Hydraulic Institute and Europump lifecycle-cost summary frames cost comparisons around comparable output and includes energy, maintenance and downtime. The breakdown below considers cartridges and a changeout allowance. Add measured costs for energy and interruption, and consider rejected liquids and disposal costs, if applicable. Keep the same cost boundary for both cases.
Use the existing Changeout Cost Input Worksheet to total your entered cost categories. It totals one intervention’s inputs; the calculation here adds the accepted-volume denominator and shows where the bank comparison changes direction.
Accepted-Volume Cost Comparison
Assumed inputs: both candidate banks contain four elements and meet the same declared quality target. The intervention allowance is $120 per changeout, comprising $60 labor, $40 planned interruption and $20 disposal. All volumes in the accepted-volume row have been released under the same sampling plan.
| Input or result | Candidate A | Candidate B |
|---|---|---|
| Elements per bank | 4 elements | 4 elements |
| Price per element | $75/element | $110/element |
| Cartridge purchase | 4 × $75 = $300 | 4 × $110 = $440 |
| Changeout labor | $60/run | $60/run |
| Planned interruption | $40/run | $40/run |
| Disposal allowance | $20/run | $20/run |
| Included run cost | $420/run | $560/run |
| Accepted volume | 400 m³/run | 600 m³/run |
| Cost per 1,000 m³ accepted | $1,050 | $933.33 |
| If B delivers only 500 m³ | $1,050/1,000 m³ | $1,120/1,000 m³ |
Calculation: A costs ($300 + $120) ÷ 400 m³ × 1,000 m³ = $1,050 per 1,000 m³ accepted. B costs ($440 + $120) ÷ 600 m³ × 1,000 m³ = $933.33. Its higher element price is offset by more accepted output. At only 500 m³, B rises to $1,120 and loses that advantage.
The break-even accepted volume for B is $560 ÷ ($420 ÷ 400 m³) = 533.33 m³. Under these inputs, finance needs B to surpass this volume to have a lower included unit cost. A purchasing team wanting lower operating costs has a bank-level trial question: can the arrangement deliver enough accepted volume between whole-bank interventions?
Quality control determines release of the denominator. Match sample times to meter readings; segregate pending-quality volume, and apply the approved release rule consistently. Add the calibration status and uncertainty of the flow meter to the comparison. If the apparent advantage for B is smaller than the measurement uncertainty, the cost ranking is uncertain.
Long service life at standby is a different duty history to continuous production. Consider the online state history when comparing on-stream life. A longer service life can deliver less accepted volume when the bank spends more of its cycle below production flow.
Hand Over an Event-Aware Bank Record for Supplier Review
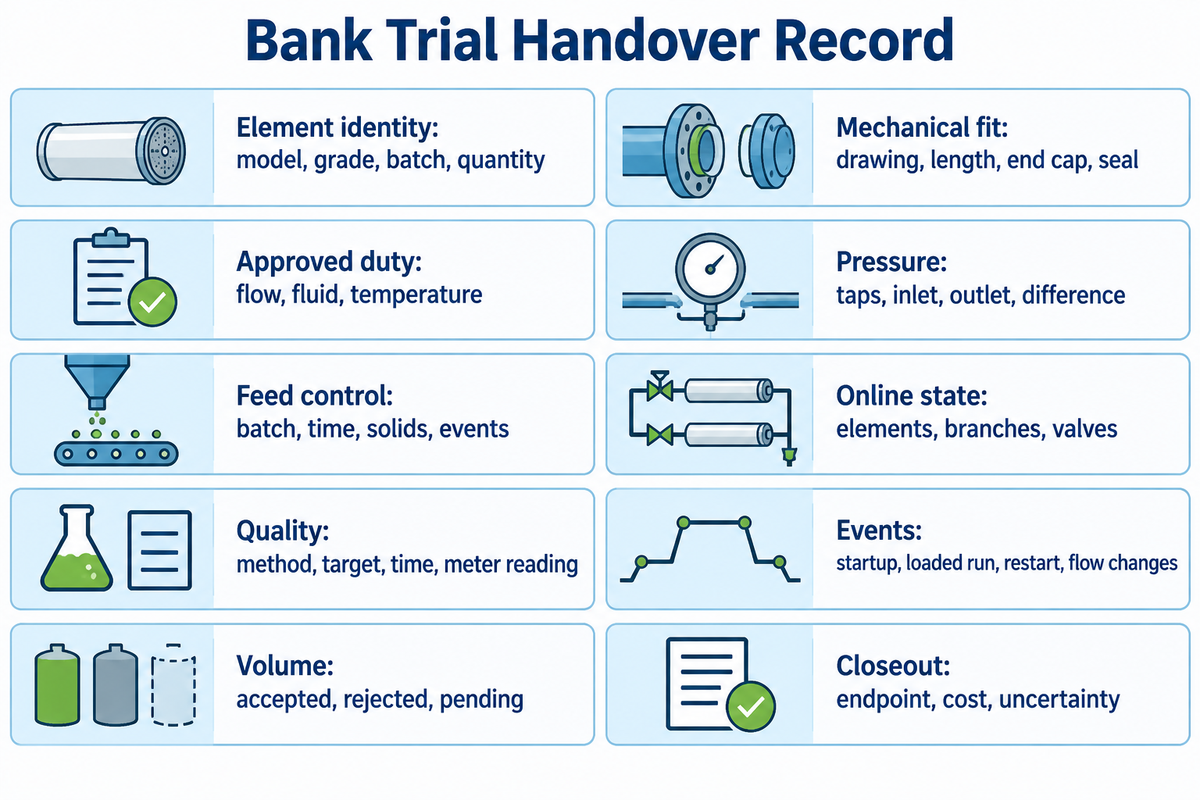
Supply a time series linking each bank arrangement to the corresponding pressure, flow and quality records. A supplier needs to see when branches entered/left service and what volume intervals were accepted. A list of installed specifications alone won’t allow for the reconstruction of the effects of a peak-demand event or loaded restart.
The 2012 EPA/NSF bag-and-cartridge challenge protocol describes the complete unit, loading-stage challenges and sampling quality controls within its drinking-water verification program. An industrial trial can borrow the recording discipline while defining its own application-specific tests with the responsible process team.
The existing Duty Data Checklist collects the application inputs for configuration review. Complete that intake once, then attach the event record below. The checklist measures input readiness; this table preserves what the bank actually did during the trial.
Bank Trial Handover Record
| Record group | Entry and units | Owner |
|---|---|---|
| Element identity | Model, grade, batch and quantity | Procurement |
| Mechanical fit | Drawing, length in inches, outside diameter in mm, end cap and seal | Engineering |
| Approved duty | Flow in m³/h or gpm; fluid and temperature in °C | Process |
| Pressure boundaries | Tap locations, inlet/outlet and differential pressure in bar | Maintenance |
| Feed control | Batch, time, solids tests and upstream treatment events | Operations |
| Online state | Elements and branches in service; valve changes | Operations |
| Quality samples | Method, acceptance target, sample time and associated meter reading | Quality control |
| Event coverage | Startup, loaded operation, restart and flow changes | Process and quality |
| Volume release | Accepted, rejected and pending volume in m³ | Quality control |
| Run closeout | Endpoint reached, intervention cost and measurement uncertainty | Operations and finance |
Equal downstream acceptance criteria must be applied to the sample being compared, including any required product recovery. Group comparable feed batches and repeat relevant bank states before you can attribute a difference to a new arrangement. NIST’s randomized-block guidance explains controlling nuisance factors such as batch or time. Where metering and sampling variation obscures the difference, report the comparison as inconclusive.
Duty-review request: Confirm the installed housing drawing, online branch combinations, flow profile and permitted pressure/temperature envelope with the supplier, as well as the nominal length (20″, 40″ or 60″) where applicable, fluid composition, and any cleaning exposure. Attach timestamped transition records, quality release intervals and actual intervention costs rather than a pressure screenshot without its bank state.
For food and beverage or chemical processing service, keep the application-specific quality and cleaning conditions in that same record. Keep the approved pore size and absolute filtration basis in the intake file. Neither field should change silently during a bank-state comparison; the existing fundamentals guide explains those media terms.
ECOFILTRONE™ supports application review, specification verification, replacement matching and customized filtration. Bring the completed duty record to the glass-fiber high-flow configuration and replacement review. This keeps a product proposal tied to the actual operating requirement, including the changeout burden the plant and finance teams must accept.
Key takeaway
Choose the cartridge bank that sustains the required quality and accepted flow through the real duty cycle. Compare included cost per 1,000 m³ accepted only after feed, event sampling and measurement conditions are aligned.
Frequently Asked Questions
What’s the maximum flow rate per element?
Capacity in the installed bank
Use the exact model’s flow curve and the approved bank arrangement. Pall lists up to 1,900 lpm, or 500 gpm, for specified long elements with relatively clean fluids; that figure isn’t a design rating for another cartridge family. The installed duty also includes housing and connecting losses, fluid viscosity and the number of elements actually online.
How often should high flow filter cartridges be replaced?
Replacement versus bank continuity
Replace them at the approved pressure, accepted-flow or quality endpoint, or earlier under the site’s maintenance plan. For a bank, also record which vessels remain online and how the intervention affects useful production. Use comparable completed cycles to plan stock and labor; a calendar interval from another site leaves out feed loading and the installed continuity requirement.
Can high flow filter cartridges be combined with other filtration technologies?
Position in the treatment train
Yes. A bank can operate alongside strainers, bag filters or membrane treatment when the stages have compatible duties. Record an upstream cleaning or feed upset as a bank event because it changes the challenge reaching the cartridges. Keep the required downstream quality unchanged when comparing arrangements, and include the affected volume interval in the acceptance record.
Can high flow filter cartridges be customized?
Customized configuration
Yes. ECOFILTRONE™ reviews customized filtration requirements against the application, including fit and operating conditions. Send the duty record and installed interface drawing.
What information is needed for Pall, Parker, 3M CUNO or Pentair replacement matching?
Replacement matching inputs
Supply the original part number, installed housing drawing, element length, end connection, seal and current duty. Older records may use 3M or 3M CUNO names; preserve the actual model identifier rather than match by a brand label. Include the retention basis and fluid exposure, then compare the proposed replacement’s assembly limits and flow curve before the controlled trial.
Turn the operating record into a filter proposal
Share the bank drawing, flow history and quality target with ECOFILTRONE™. Our team can review selection, replacement matching and the next trial configuration.
Editorial basis: Government and academic sources, public product literature and stated examples. Named external tests retain their original application and ownership. The worked cost model covers purchase and changeout costs; site energy and other costs can be added on the same basis.
References & Sources
- U.S. EPA: Overview of Drinking Water Treatment Technologies.
- EPA/NSF: Generic Protocol for Product-Specific Challenge Testing of Bag and Cartridge Filter Systems, 2012 archived protocol.
- EPA/NSF: Rosedale Bag and Rigid Cartridge Filter System verification statement, 2001 historical study.
- NIST: Randomized Block Designs.
- Krupp et al.: Scaling-up of Multi-capsule Depth Filtration Systems, original paper, online 2016; Pall affiliation and funding disclosed.
- ISO 3968:2017: Differential Pressure versus Flow, official public scope and current edition status.
- DOE, Hydraulic Institute and Europump: Pump Life Cycle Costs, executive summary; comparison methodology.