Get in touch with ECOFILTRONE™ Company




Seawater Desalination (SWRO) Filtration adjusts seawater for reverse osmosis by controlling materials that may load filters, block membrane channels, or contribute to fouling. Assess the intake, upstream pretreatment, cartridge guard where installed, and membrane response together.
The questions plant operators and engineers (and potential industrial water treatment buyers) most often have are probably: “Why do some plants foul?” and “What’s wrong with a feed-water quality that looks acceptable to you?” Reliable seawater desalination demands control of suspended particles and appropriate management of residual organic and biological loads. A plant that must desalinate seawater needs more than one favorable feed-water quality reading. The answer usually requires separating particle control from dissolved organics and biological risks, and aligning observations and operating conditions.
Start with the changed condition
Identify whether the change began at the intake, across pretreatment, at the cartridge housing or in the RO train. Collect comparable readings before changing a filter rating. Evaluate replacement cost only after the required water quality and equipment limits are satisfied.
How filtration and reverse osmosis divide the work
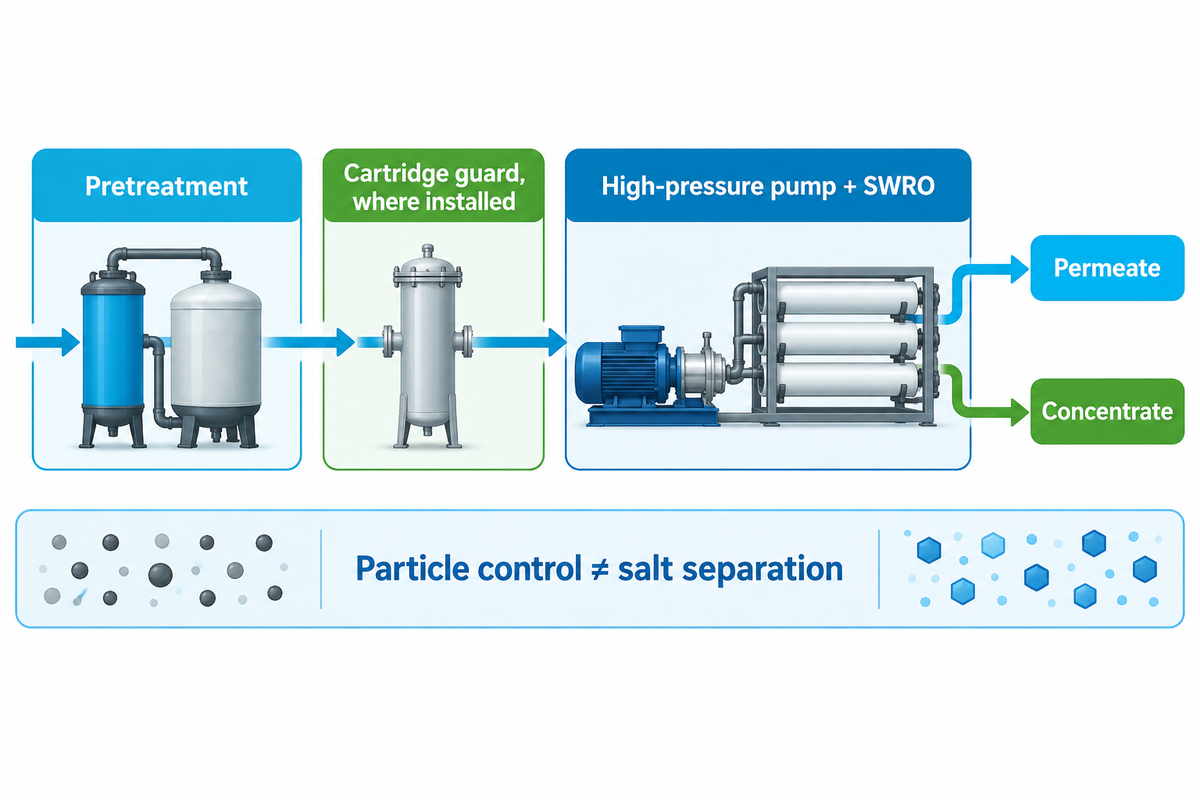
The pretreatment process removes some suspended material before salt separation to protect a seawater reverse osmosis system. The RO membrane performs the dissolved-salt separation under pressure. Treat those as different duties: a clean-looking cartridge outlet can still carry dissolved salts and organic material that matter to downstream membrane performance.
The Bureau of Reclamation pretreatment pilot report shows media filtration and ultrafiltration upstream of cartridge filtration and SWRO. The sequence is a process reference and not a requirement that each desalination system contain all the steps. Existing process design determines the barriers, chemical conditioning and sampling points. Reverse osmosis desalination systems use pressure-driven membranes for salt separation. Water desalination requires verification of the finished water, not just confirmation that a filter is in place.
| Stage or stream | Main purpose | Question to carry forward |
|---|---|---|
| Intake screen | Intercept large marine debris | Has the incoming load or screen condition changed? |
| Coagulation | Destabilize selected colloidal material | Does the chosen chemistry suit the actual feed water? |
| Flocculation | Build aggregates that later treatment can separate | Can the following stage capture the resulting floc? |
| Clarification or dissolved air flotation | Separate selected solids and buoyant material | What residual load reaches filtration? |
| Media or multimedia filtration | Remove material through the filter bed | Is outlet quality stable through the run and backwash cycle? |
| UF or MF membrane pretreatment | Provide a particulate barrier within its validated duty | What passes through, and how is integrity monitored? |
| Cartridge guard, where installed | Intercept residual particles before sensitive equipment | Are loading, outlet quality and resistance behaving normally? |
| Chemical conditioning | Address defined process risks | Are chemical effects and compatibility being monitored? |
| High-pressure pump and SWRO array | Drive membrane separation into permeate and concentrate | Are normalized production and pressure trends stable? |
| Product-water post-treatment | Prepare permeate for the intended use | Do finished-water verification results meet the application? |
What contaminants does reverse osmosis remove?
Reverse osmosis membranes separate much of the dissolved salt from saline feed water and can reduce other constituents according to the membrane and operating conditions. Its permeate has a lower salt concentration than its feed. Removal of salt and other impurities and finished-water suitability require complete system design and verification.
A seawater desalination system produces permeate and brine water, which is also called a concentrate. The membrane allows water molecules to pass more readily than many dissolved ions. Salt rejection belongs to that membrane separation process. Assess the reverse osmosis process and its pretreatment against their separate duties. Ordinary particle cartridges don’t convert seawater into fresh water.
In desalination projects facing water scarcity, a coastal factory and an island drinking water supply may share a seawater intake but need different product-water treatment. A source of drinking water requires its own finished-water verification. Industrial water treatment applications may require additional polishing; a source for drinking water may require remineralization and final disinfection. These steps generally follow the water needs of the user rather than the apparent clarity of the filtered sea water.
Build pretreatment around source-water changes

Seawater pretreatment should be designed to accommodate the varying particulate, organic and biological loads in the intake. An open intake exposed to storm sediment or algal events presents a different operating problem from a stable beach well. Compare the quality of the changed feed to the pretreatment outlet and decide if the final guard cartridge requires a different rating.
Source type limits the assessment, but doesn’t complete it. Ocean water should be assessed via its actual intake and seasonal record. A beach well or other subsurface intake can have a different contaminant profile than surface water. Seasonal records, maintenance events and the actual feed water quality are more useful than assuming that all water from the ocean behaves alike. Don’t transfer a brackish water operating basis to a high salt seawater feed without first assessing the process. Industrial RO systems require specification based on their actual feed.
In Abushaban and colleagues’ 2021 full-scale SWRO research, reductions in particulate fouling indicators were above 80% with the studied pretreatment, while removal of the measured organic and biological fouling potential was 24-41%. This describes the studied process. It illustrates that the successful removal of particles can’t be equated with fulfillment of every other water quality objective.
In a hypothetical, open-intake, storm-event scenario, make observations across the treatment train. The cartridge run shortens after the intake becomes obviously more turbid. Replacing the cartridge with a finer grade immediately alters the final barrier’s load, but doesn’t clarify the reason for the carryover. The useful comparison is the same event at the raw intake, the outlet of the main pretreatment and the cartridge outlet, alongside flow and pressure records. A change that appears only across the housing calls for different checks.
Record the operating context of each sample, including location, time, flow, temperature, upstream backwash and recent chemical changes. Keep these records with the plant’s approved event-response plan. Management and control of the event require knowing when water flows changed as well as when the samples were taken. A grab sample collected post event may describe a different water source condition from the one that loaded the filter.
Media filtration and UF: compare the operating tradeoffs
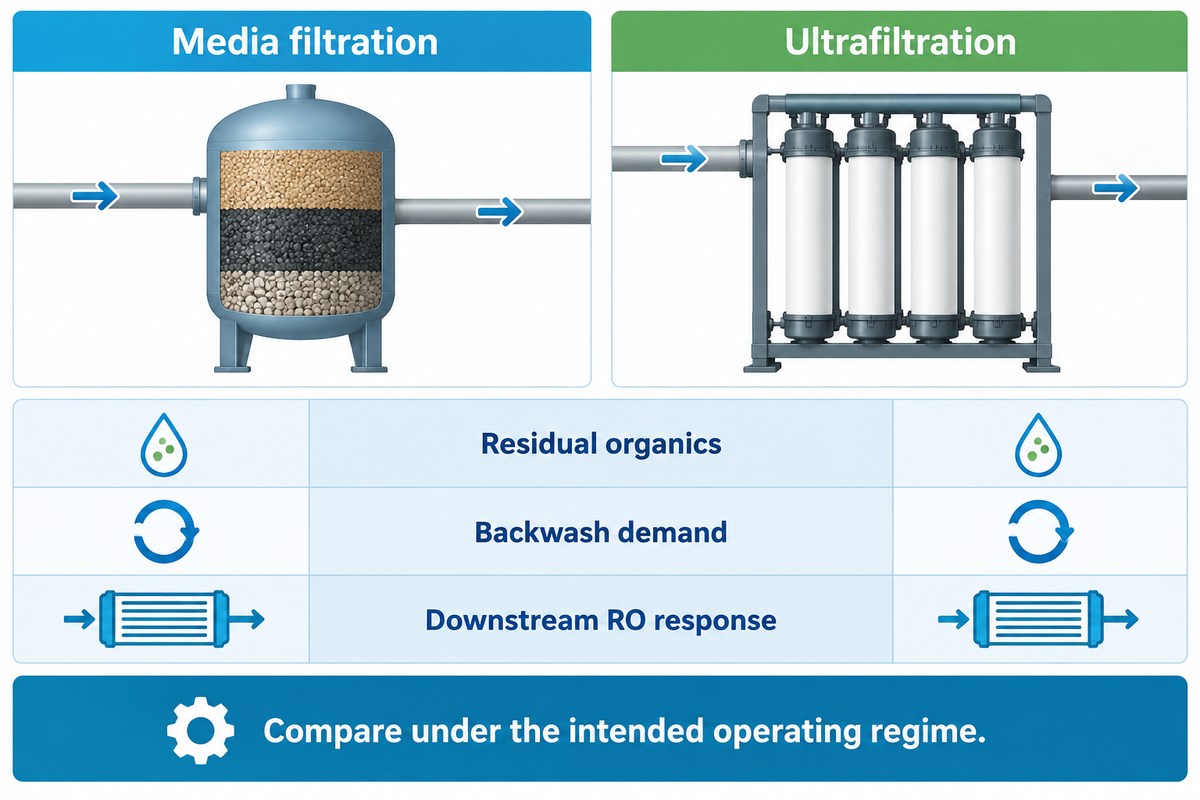
Media filtration and ultrafiltration should be compared by their effect on the complete pretreatment and RO system, including residual organics, operating workload and downstream performance. Understand the feed and operating regime as well as the endpoint in each comparison.
Li and colleagues’ 2024 comparison used synthetic seawater with model contaminants to compare coagulation plus sand filtration with coagulation plus UF. The reported SDI was lower after UF, but the downstream RO test showed a greater flux decline. The tested feed and operating regime determined that ranking.
| Reported endpoint | Coagulation + sand | Coagulation + UF |
|---|---|---|
| Dissolved organic matter removal | 69.6% | 70.2% |
| Reported silt density index | Above 3 | Below 2 |
| RO flux after 24 h | About 80% of initial flux | About 65% of initial flux |
While bulk organic removal was similar, remaining organics differed. In the scope of that study, the UF route left material associated with a denser downstream fouling layer. Reported UF-effluent SDI is an experimental observation; it does not alone establish that the sample falls within the current ASTM method’s scope and application.
The Reclamation study noted benefits of UF at one of its study site pilot locations and serious operating challenges at another. Consider short term pilot plant cartridge-life results and laboratory RO flux results as separate observations. Combining their percentages into an industry average would throw away the reasons for the observations.
| Compare | Evidence to request | Who uses it |
|---|---|---|
| Intake variability | Representative events as well as normal operation | Operations |
| Particle outlet | Comparable sample points and test methods | Quality team |
| Residual organics | Relevant organic fractions or biological potential | Process engineer |
| Downstream RO response | Normalized membrane trends over the trial | Operations |
| Backwash demand | Frequency, volume and recovery behavior | Operations and finance |
| Cleaning | Actual interruptions and permitted chemistry | Maintenance |
| Integrity or bypass | Monitoring method and investigation record | Quality team |
| Waste handling | Backwash or sludge route and site constraints | Plant manager |
| Recurring cost | Energy, chemicals, consumables, labor and accepted output | Finance |
A small footprint may be advantageous in a space constrained retrofit, and a simple maintenance routine may be advantageous in an isolated facility. Still, containerized desalination requires an evaluation of intake and operating conditions. Filtration systems should be compared on the duty they can sustain with the operating support provided. Seawater RO systems should be assessed based on downstream membrane response and the quality of the pretreatment outlet. Systems are designed around a particular feed and treatment objective; the comparison should preserve both.
Read SDI, turbidity and biological signals together
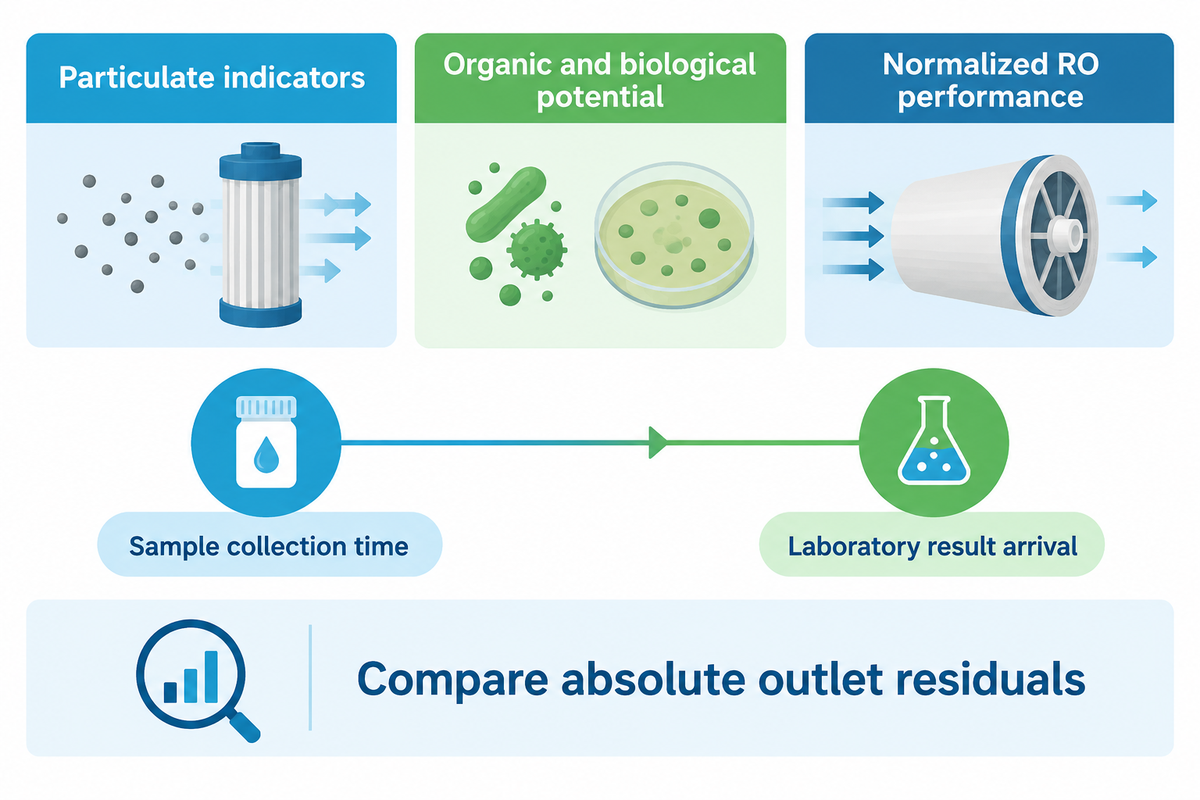
SDI, turbidity, and biological measurements assess different components of SWRO feed water quality. Use particulate indicators to evaluate their defined particle related response, and handle other organic and biological risks, if any, in a separate manner. Compare absolute values of outlet samples and the percentage removal, and distinguish the time of sampling from the time a laboratory result becomes available.
The public scope of ASTM D4189-23 applies to relatively low-turbidity water, below 1.0 NTU, and excludes effluents from most reverse osmosis and ultrafiltration systems. The warning states that the test-membrane manufacturer and temperature can affect comparability. The laboratory should match the sample and method to this scope when reporting an in-scope result.
“The SDI can serve as a useful indication of the quantity of particulate matter in water.”
| Signal | What it contributes | What to investigate alongside it |
|---|---|---|
| Intake turbidity | Rapid optical indication of a changing load | Event timing and downstream samples |
| SDI at an applicable sample point | A particulate fouling-related test response | Method scope, temperature and test-membrane consistency |
| Modified fouling index | A specified filtration-test response | Exact method, sample and relevant operating regime |
| Organic carbon | Bulk organic concentration | Organic fractions and biological availability where relevant |
| UV absorbance | Response associated with selected absorbing compounds | Material not represented by that optical response |
| Microbial ATP | An assay-specific biological signal | Sample handling, background and process location |
| Bacterial growth potential | Growth supported under the chosen test conditions | Absolute residual, assay duration and inlet baseline |
| Cartridge differential pressure | Hydraulic resistance at the recorded flow | Instrument condition and outlet quality |
| Normalized RO performance | Membrane response adjusted for operating conditions | Possible particulate, organic, biological, scaling or other causes |
The 2021 study of Dhakal and colleagues clarifies the distinction between percentage and residual. A DMF plant (using cartridges) and a UF plant (DAF-UF) were compared. The compared DAF-UF plant removed a higher percentage of bacterial growth potential, yet had a higher absolute growth potential in the RO feed and more frequent cleaning than the DMF-cartridge plant. Different plants were involved, so the observation cannot identify UF as the cause.
The growth-potential method used in this study was based on flow cytometry and took 2 to 3 days. A method for measuring biological potential cannot be substituted for another just because they both deal with biology.
If a quality report states that the percentage removal of growth potential improved, ask what entered the process and what was remaining at the outlet. Improving the percentage removal doesn’t mean that the RO feed has become less prone to fouling.
Diagnose fouling from paired filtration and membrane trends
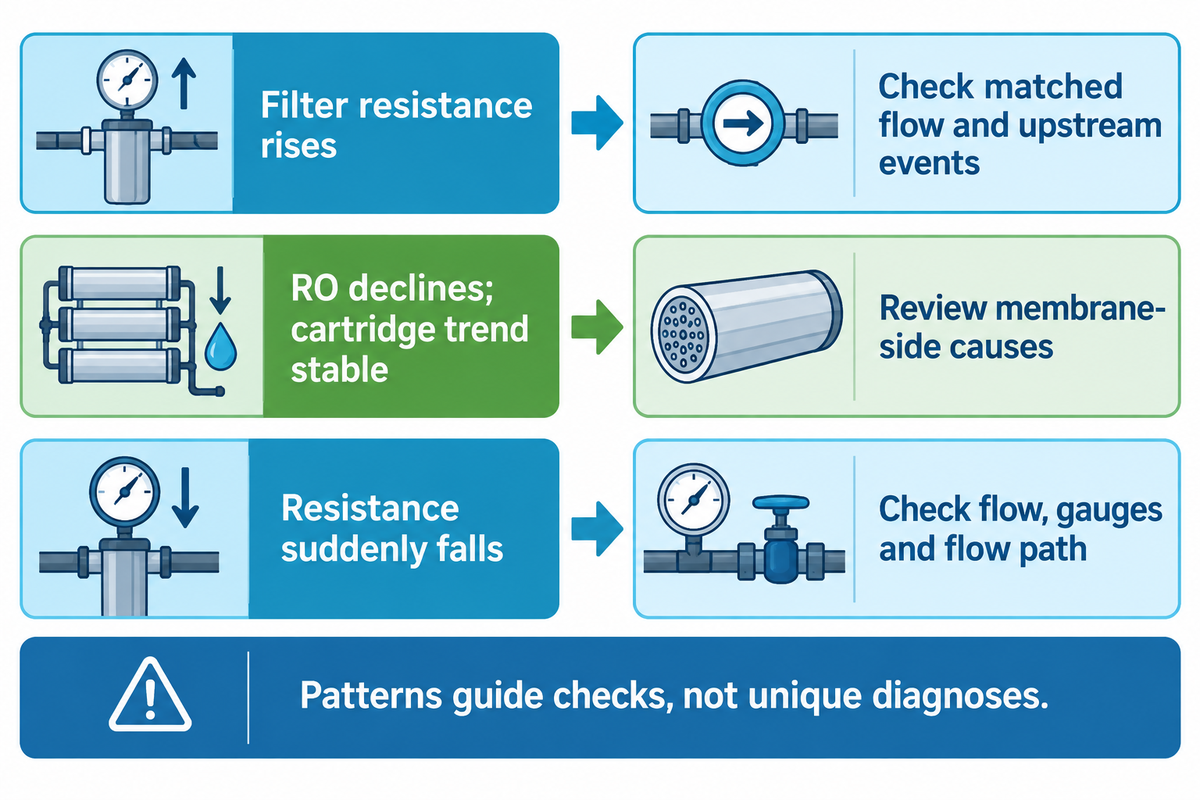
Paired cartridge and membrane trends help analyze an investigation when SWRO performance changes. Match the flow, sample timing and normalization basis, then test competing explanations for the observed pattern. Pressure and water-quality trends can guide the next evidence to collect, but they do not uniquely identify the foulant or its source.
Vrouwenvelder and colleagues’ 2008 NF/RO investigation found that increased normalized pressure drop wasn’t specific to biofouling, and the pressure measurement used wasn’t sufficiently sensitive to early fouling. Its mixed feed-water scope doesn’t justify an SWRO-specific diagnosis, but the warning against pressure-only attribution is appropriate.
| Observed pattern | Competing explanations | Next evidence |
|---|---|---|
| Cartridge resistance rises; outlet stable | Higher captured load or changed flow | Matched-flow baseline and upstream event record |
| Resistance rises; outlet worsens | Overload, carryover or a changing particle fraction | Samples on both sides and upstream treatment record |
| Resistance stays low; outlet worsens | Changed feed, bypass or unsuitable retention duty | Instrument checks, assembly record and sample comparison |
| Resistance suddenly falls | Flow reduction, measurement fault or an altered flow path | Flow and gauge checks; permitted equipment inspection |
| RO performance declines; cartridge trend stable | Dissolved/biological load, scaling or another membrane-side cause | Normalized RO data and targeted analysis |
| Both stages deteriorate | A shared upstream event or several concurrent causes | Aligned timeline across the process |
| Readings change after chemical adjustment | Changed contaminant behavior or treatment interaction | Dosing history and qualified process review |
| Values differ between parallel housings | Unequal flow/loading or measurement differences | Housing-level flow and pressure verification |
| Cleaning fails to restore the baseline | Incomplete cleaning, persistent load or equipment condition | Approved cleaning record and specialist investigation |
In a second illustrative case, cartridge pressure loss remains at its matched flow baseline while normalized RO membrane performance deteriorates over several runs. Another cartridge change may still result in the same membrane problem. First, confirm measurements are described for the same operating condition. Then compare membrane-feed chemistry, available organic or biological evidence, recovery and the cleaning record. A stable trend of the guard-filter doesn’t exclude downstream issues, nor does it prove the pretreatment process is adequate. In an SWRO plant, ensure sample identity is clear: pretreated seawater is the feed presented to RO and treated water must be assessed relative to its intended use.
In Zhang and colleagues’ 2011 microbial study, different dominant communities were observed on RO membranes and cartridges. Concurrent biological fouling therefore cannot, alone, prove that the cartridge seeded the membrane. Other studies have identified cartridge biofouling as a potential downstream problem; attribution to the process requires evidence.
The 2020 full-scale BGP monitoring study reported an association with normalized membrane pressure drop, and suggested further studies with additional plants and longer durations. In the absence of conclusive evidence, an association can be viewed as a reason for further investigation. The operating and cleaning limits defined by the plant must be enforced during the investigation. Contact the water treatment process owner when the required operating response falls outside the consumable’s defined duty.
Choose a replacement point using quality, pressure and cost
A replacement point should satisfy equipment limits and outlet quality before minimizing operating cost. Water production must be measured on the same acceptance basis across the compared runs. Compare the cost of accepted output under equivalent duty, including elements, changeout work and any measured hydraulic penalty. The least expensive cartridge purchase can become the more expensive operating choice, but a pressure-only calculation cannot establish an optimum.
Farhat and colleagues’ 2020 desalination study compared seven types of cartridges at a full-scale plant using produced-water quantity, quality and costs. Replacement economics depended on the electricity tariff. The study provides a method to compare cartridge options rather than establish a universal service interval, or use the current price of cartridges as a benchmark.
How should service life be compared?
For comparison runs, ensure the same retention requirement and acceptance basis. Record feed conditions, housing flow and changeout criteria. Report accepted volume per cartridge, and hours, pressure loss and labor. If one run had an algal event and the other didn’t, the longer run doesn’t automatically mean the better cartridge.
The PP pleated filter cartridges guide addresses construction and rating questions that can impact comparison. Differences in melt blown filter cartridges can lead to different loadings; compare actual grade and duty. The High flow cartridge trial guide and the SWRO cartridge trial comparison ledger address comparison on controlled duty and run records, respectively.
Filter pressure-penalty worksheet
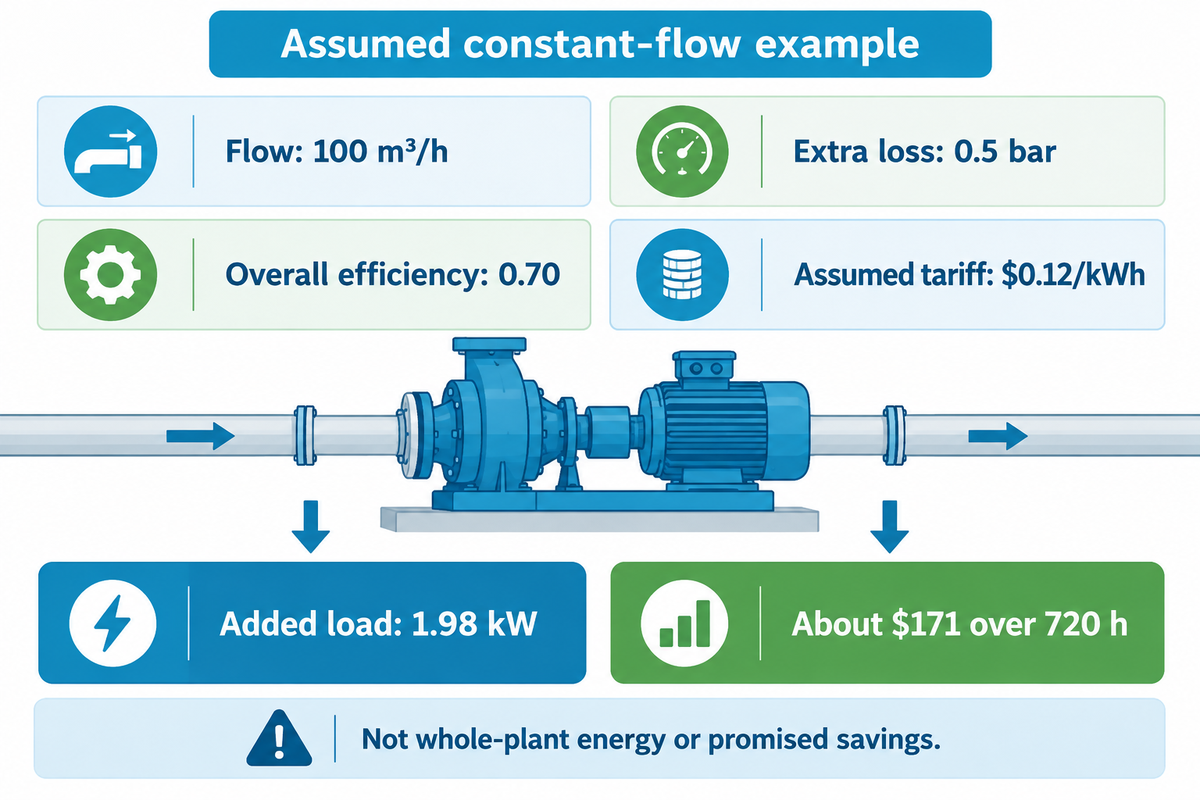
At constant flow, extra filter pressure loss raises the required hydraulic output when the pump compensates for that loss. The DOE pumping sourcebook and Hydraulic Institute formula sheet, pages 5–6 distinguish hydraulic output from input power and efficiency. For constant flow, if the pump actually compensates for the extra filter loss, an approximate added electrical load is:
Added electrical power (kW) = extra pressure loss (bar) × flow (m³/h) ÷ (36 × overall efficiency)
Use overall efficiency as a decimal for the pump and motor/drive together. The conversion follows 1 bar = 100,000 Pa and 1 h = 3,600 s. Confirm the efficiency and the control response at the actual operating point.
For a teaching example, assume a guard-filter bank carries 100 m³/h, its extra pressure loss remains at 0.5 bar, and combined overall efficiency stays at 0.70. The pump maintains flow by compensating for that loss. Over 720 operating hours, at an assumed electricity tariff of $0.12/kWh, the estimated added load is 0.5 × 100 ÷ (36 × 0.70) = 1.98 kW. That’s about 1,429 kWh and $171 for the stated period.
This example assumes the additional loss is constant. A real filter’s pressure loss changes over a run, so calculate over time intervals or use measured power where suitable. A constant speed or variably controlled system may lose flow instead of adding the estimated electrical demand. Changes in operating point, efficiency and throttling also impact the result. The estimate is a filter-loss scenario, not whole-plant SWRO energy use or a promised saving from replacement.
| Assumed extra loss | Added power | Added electricity | Calculated charge |
|---|---|---|---|
| 0.1 bar | 0.40 kW | 286 kWh | $34 |
| 0.25 bar | 0.99 kW | 714 kWh | $86 |
| 0.5 bar | 1.98 kW | 1,429 kWh | $171 |
| 0.75 bar | 2.98 kW | 2,143 kWh | $257 |
| 1 bar | 3.97 kW | 2,857 kWh | $343 |
| Record | Use in the comparison |
|---|---|
| Accepted output, m³ | The denominator after the quality requirement is met |
| Cartridges installed, pieces | Element consumption on the actual housing basis |
| Operating time, h | Run duration and exposure to changed feed |
| Flow, m³/h | Comparable hydraulic duty |
| Pressure loss, bar | A matched-flow trend through the run |
| Measured input power, kW | Check whether the expected penalty occurs |
| Electricity tariff, $/kWh | Site-specific energy charge |
| Changeout labor and interruption | Actual work and production consequences |
| Quality failures and membrane effects | Consequences excluded by a purchase-price-only view |
To determine the recurring replacement cost, divide the agreed element, labor, interruption and attributable energy costs by the accepted volume. Don’t count the same downtime twice. A quality failure or an equipment limit can require action before the mathematical cost minimum; the worksheet must not become a reason to run beyond an approved limit.
Suppliers and application support
ECOFILTRONE™ is a supplier of industrial filtration products based in Qingdao, China. Its consumables include high flow, pleated, membrane, melt blown and string wound filter cartridges, as well as industrial liquid filter bags. For configuration and replacement matching, the Seawater Desalination (SWRO) Filtration solution page describes the application-review process. Product-related technical and compliance documents need to be validated against the actual product and the certificate holder.
What algae research changes about pretreatment reviews
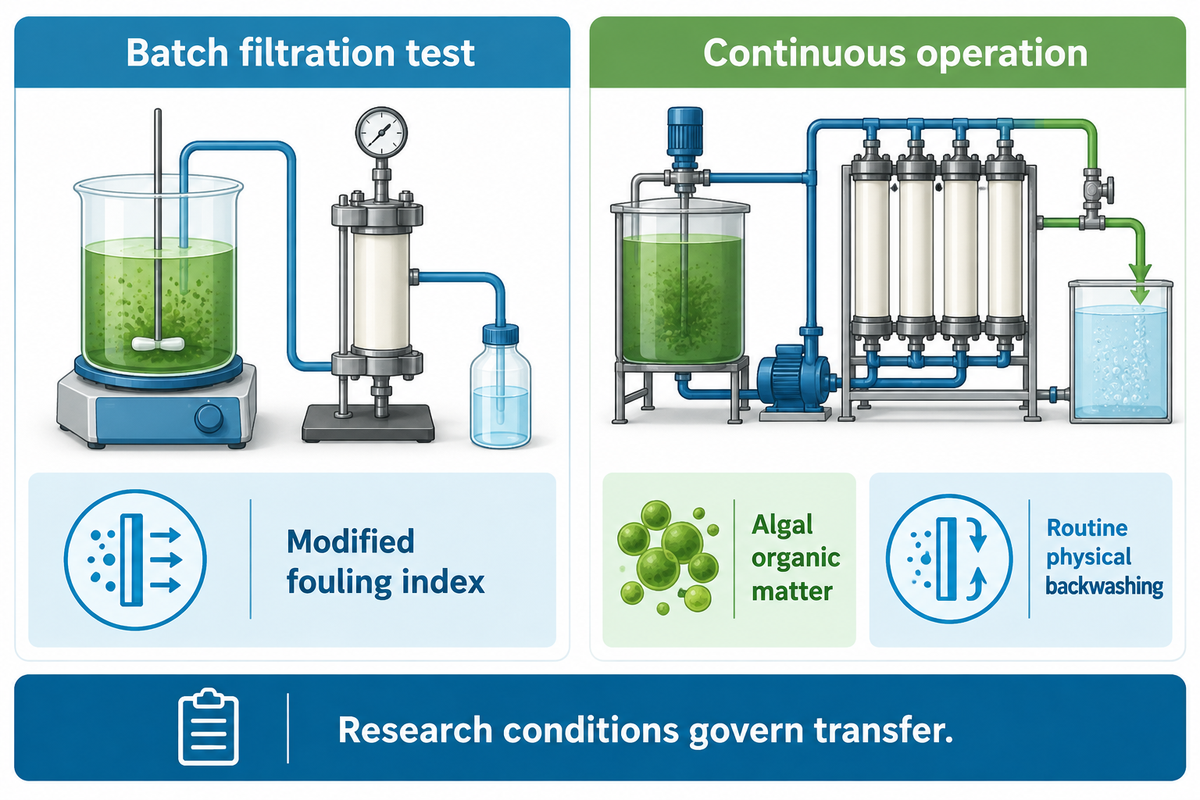
Recent pretreatment studies show that understanding the operating regime and residual organic material is valuable for comparison. For example, a batch filtration result might rank options differently from a continuous process with backwashing. Ask how pretreatment performs during the real event and clean cycle instead of assuming what happens in a lab is directly related to what happens in a seawater reverse osmosis (SWRO) plant.
In a 2025 ceramic-UF study by Xu and colleagues, algal organic matter was important to continuous fouling behavior. Elevated modified fouling index values in batch filtration tests did not reliably indicate fouling during continuous operation with routine physical backwashing. That result belongs to the tested ceramic membrane and operating conditions; it does not establish one replacement indicator for every pretreatment system.
In a 2026 pilot study by Li and colleagues, the focus is on preoxidation, dissolved air flotation, and sand filtration for algae-affected feed. Its value for an operating review is the combined treatment process. This sea water desalination research evaluates pretreatment as a train rather than a single interchangeable filter. Results of chemical concentrations and removals require process-specific evaluations before any operational use can be considered.
For an algal event, use the intake timeline, pretreatment outlet samples and normalized membrane performance. Determine if the tests indicate intact cells, released organic materials or a combination of both. Assess how backwashing, storage and chemical conditioning impact the material at the RO feed. Document changes in the same event record so that a later assessment can distinguish a changing feed from a treatment change.
To consider desalination equipment, ask suppliers to justify the water sources and operational periods used to illustrate performance. Advancements in technology are only helpful when their operational conditions match the conditions under review. A purified water test says little about recovery after a stressful condition. For a retrofit, define the required outlet, available operating support and interruption constraints before comparing a new barrier with the existing one. Any new testing should be done within the approved operational plan for the plant.
Frequently asked questions
Can freshwater be made from seawater by reverse osmosis?
Yes. RO separates a lower-salinity permeate from seawater under pressure.
Reverse osmosis uses a selective membrane to separate water from much of its dissolved salt. Pretreatment controls selected foulants before that separation. Finished-water suitability depends on the complete treatment train, product-water requirements and verification; a cartridge filter by itself doesn’t convert seawater into freshwater. Post-treatment follows the intended industrial or drinking-water use.
Where does a cartridge filter sit in an SWRO train?
Where specified, it is a particulate guard upstream of the high-pressure pump.
The installed process design controls the actual position and whether a separate cartridge stage is needed. It can follow media or membrane pretreatment and intercept residual particulate material. Interpret its operating record alongside upstream loading, membrane-feed quality and approved equipment limits. Its presence doesn’t establish that all organic or biological fouling risks are controlled. Check how much seawater actually passed through the housing during the run before comparing cartridge loading.
Can a finer rating fix unstable upstream pretreatment?
A finer cartridge cannot substitute for control of the upstream process.
It can retain a different particle fraction while leaving dissolved organics, biological growth potential or the original carryover event unresolved. Review samples and operating trends across pretreatment stages before treating a micron-label change as a solution to membrane fouling. Check the required retention basis, hydraulic duty and approved element limits before changing the grade.
What is the desalination process?
Desalination separates dissolved salts from saline water.
An SWRO train combines intake, pretreatment, pressure-driven membrane separation and the post-treatment required for its product water. Cartridge filtration can protect later equipment within that process; the RO membrane provides salt separation and produces permeate plus concentrate.
Why can membranes foul when turbidity looks low?
Turbidity does not describe every membrane foulant.
Low turbidity can coexist with dissolved organic material, biological growth potential or material poorly represented by that optical reading. Compare particulate indices, relevant organic and biological evidence, and normalized membrane trends at defined sample points. Check sampling and result times as well as removal percentages and absolute residual values. The pattern narrows hypotheses; it doesn’t identify a unique foulant without further investigation.
Do all seawater desalination plants need UF?
No. The required pretreatment route follows the intake and process duty.
Some plants use conventional pretreatment, while others use a membrane route or a combined train. Intake variability, outlet requirements, operability and recurring cost shape that choice. UF needs appropriate upstream control, maintenance and performance monitoring.
What should operators record during an algal event?
Record the intake event and the corresponding response across pretreatment and RO.
Include sample locations and collection times, particulate and organic or biological measurements available at the plant, flow, filter pressure trends and normalized membrane performance. Keep process adjustments, backwashing, storage changes and interruptions on the same timeline. Distinguish laboratory result-arrival time from sampling time. The plant’s approved response plan and equipment limits govern intervention; a research-scale chemical dose or flux isn’t a universal operating setting. Keep the intake and outlet samples tied to the same event, including any changes that occurred while the samples awaited analysis.
Put the next review around the observed failure
An event review at pretreatment is warranted for a change in intake. A typical seawater RO diagram can’t replace the explanation of what changed at the plant. Worsening membrane performance with stable cartridge readings calls for a broader fouling investigation. Increased matched-flow filter resistance, with acceptable quality, warrants a bounded replacement cost comparison. Begin with the relevant operating record and pick the next check based on the operating condition.
ECOFILTRONE can review the filtration consumable duty and available operating data for product selection or replacement support.
References & Sources
- Reclamation Report113: seawater RO pretreatment pilot research
- Abushaban et al2021: full-scale particulate, organic and biological pretreatment
- Li et al2024: coagulation, sand and coagulation, UF comparison
- ASTM D4189-23: public scope and current catalogue
- Dhakal et al2021: bacterial growth potential and absolute residual
- Vrouwenvelder et al2008: quantitative biofouling diagnosis
- Zhang et al2011: microbial community variability
- Abushaban et al2020: full-scale BGP monitoring
- Farhat et al2020: cartridge selection and replacement optimization
- DOE/Hydraulic Institute: Improving Pumping System Performance
- Hydraulic Institute: Pump System Certification Formula Reference Sheet
- Xu et al2025: ceramic-UF algae pretreatment research
- Li et al2026: algae pretreatment pilot study